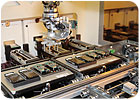
OEE quantifies how well an assembly system performs relative to its intended capacity.

By monitoring overall equipment effectiveness, engineers can uncover hidden capacity in their assembly plants. Photo courtesy Nokia Corp.
Some problems, such as a faulty part that jams a feed track, are isolated incidents. Others indicate a systemic problem, such as an entire batch of bad parts, or worse, a flawed design. A simple metric-overall equipment effectiveness (OEE)-can help engineers ferret out such problems and improve the efficiency of the system.
OEE quantifies how well an assembly system performs relative to its intended capacity. It’s calculated from three measurements: availability, performance and quality.
Availability, or uptime, is the percentage of scheduled time that the system is available to assemble parts. For example, let’s say Acme Valve runs two 8-hour shifts, each with a 30-minute break. Ideally, the system would run for 900 minutes (16 hours x 60 minutes per hour – 60 minutes). If the system unexpectedly goes down for an hour, it can only assemble parts for 840 minutes (900 – 60). The availability of the system is therefore 93.3 percent (840/900 x 100).
For calculating availability, downtime includes time spent on setup, tweaking processes, repairing equipment and waiting for parts. It does not include minor stoppages to clear jams. A world-class goal for availability is 90 percent.
Performance is the speed at which the system runs as a percentage of its intended speed. For example, let’s say Acme’s assembly system puts out 42,000 valves in a day. It’s production rate for that day is therefore 50 assemblies per minute (42,000/840). If the system was designed to produce 60 assemblies per minute, its performance is 83.3 percent (50/60 x 100).
Note that this metric does not distinguish between good assemblies and bad assemblies, complete assemblies or those aborted early. It’s the total number of assemblies started that’s important. For performance, a rating above 90 percent is considered world-class.
Quality, or first-pass yield, is the number of good assemblies produced as a percentage of total assemblies started. For example, let’s say 840 of Acme’s valves fail a leak test at the end of the line. The system’s quality rating is therefore 98 percent (41,160/42,000 x 100). When calculating quality, engineers should include assemblies rejected at any point and time in the process, even defects produced at startup, when the process may not be immediately stable. Needless to say, quality should be as close to 100 percent as possible.
To obtain OEE, multiply availability times performance times quality. For example, the OEE of Acme’s system is 76.1 percent (0.933 x 0.833 x 0.98 x 100).
Given that the manufacturing benchmark for OEE, regardless of the level of automation, is 85 percent, Acme clearly has room for improvement! Reducing downtime to just 15 minutes would boost Acme’s OEE above 80 percent, but the company’s biggest problem is performance. Too many minor stoppages to clear jams could be to blame, or a machine might be wearing out. Worse, the company might be deliberately operating the system at a reduced pace because running it at top speed produces too many interruptions. In that case, engineers may need to rethink the design of both the product and the process.
Much of the data for OEE is collected by sensors, PLCs and vision systems and can be sent automatically to software that calculates availability, performance and quality. This information can be displayed graphically on a control panel or andon board.
Operators can collect data, too. For example, operators can enter a particular code for common assembly defects or machine stoppages. This data can then be used to create Pareto charts so engineers know where to concentrate improvement efforts. If most machine stoppages are related to screws jamming a driver, it could be time for a new feeder or a new fastener supplier.


