
For example, the cost of the parts that may be consumed in testing obviously has no impact on the sample size required to provide representative test results. But, it would be unrealistic not to believe it is a consideration.
While the correct sample size is based on statistical methods, I’ve never heard someone say: “We would like to base our torque-angle-to-failure test on a sample size that will give us a 95 percent level of confidence so that the mean yield torque you report from this test is within 1 newton-meter of the actual value of the entire population.”
There are some practical reasons why we have never been tasked with that request. The most basic is that the population standard deviation is needed, but is unknown for the vast majority of tests. Typically, the test we conduct will be the first opportunity to calculate that measure of variation.
A good way to look at this question is to put it in terms closest to the test requester’s viewpoint. He wants to use the fewest parts possible, so effectively he is asking, “What am I gaining for each additional set of parts I scrap?” To answer this question, we reviewed recent reports of torque-angle-to-failure tests in which we had a larger sample size.
Seven results were examined to help provide insight into the question. The variation present in these joints prevents estimation of process parameters to a high degree of certainty at the five- to 20-parts sample sizes that are common in torque-angle-to-failure tests.
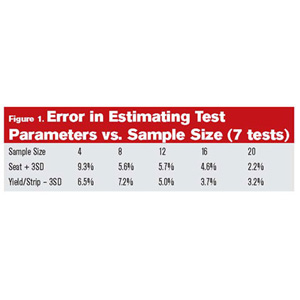
To summarize the results in a manner more accessible than probability and statistics, we need to relate it directly to test needs. The most common reason for performing a torque-angle-to-failure test is to ensure that the range of acceptable installation torque corresponds to the working range of the joint. This is often defined as falling between seating torque plus three standard deviations, and the yield or strip torque minus three standard deviations.
Figure 1 shows a trend toward reduced error as the sample size increases. The error is calculated as the percent difference in parameter values at sample sizes of four, eight, 12, 16 and 20, and the values or the same parameter at a sample size of 24. For this exercise, it was considered representative of the population as a whole (simply because it was the largest sample size common to all tests).
As I mentioned above, the lack of knowledge of process variation (standard deviation) prevents establishing statistically-based sampling. In fact, this is true only in the extreme. Most requests for testing are for designs that are incremental improvements from a previous design or are to validate a change in fastener or component supplier. In these cases, previous test data is usually available.
The mean and standard deviation for the points of interest calculated in those tests would serve as good estimates for future tests. With that in mind, Figure 2 was created as an example of how sample size can be statistically determined subject to the assumptions mentioned.
Torque parameters calculated from sample sizes common to joint testing do not always accurately predict population behavior.


