Signature Analysis Beyond Press Force
The basic concept of
press-force monitoring has evolved into
two branches. One focuses on pressing applications, but offers
assemblers more flexibility and precision when capturing information about the
force-distance curve. The other branch, called signature analysis, lets assemblers apply the
monitoring concept to applications beyond press force.
Until the mid-1990s, press-force monitoring had many more descriptions than applications. Whether it was called load-cell monitoring, pattern recognition or force monitoring, suppliers understood the concept: record a pressing process as a simple force-distance curve and use this information to improve the quality and consistency of component manufacturing and product assembly.
The basic concept of press-force monitoring remains in use, but it has evolved, so to speak, into two branches. One branch still focuses on pressing applications, but offers assemblers more flexibility and precision when capturing information about the force-distance curve.
The other branch has developed into products that let assemblers apply the monitoring concept to applications beyond press force.
In the latter approach, called signature analysis, an assembly process is run while sensors collect dynamic data for as many variables as desired. Software then plots this data instantaneously into a two- or three-dimensional curve, which is the signature of that process.
After several component runs, an ideal signature is developed for that process. Subsequent instances of the process are compared back to this ideal signature, which serves as a benchmark to verify and ensure the repeatability of the process.
“Signature analysis and traditional process monitoring provide 100 percent quality control at the time the components are assembled,” says Dave Zabrosky, North American sales and marketing manager of Schmidt Technology, a supplier of both presses and press-monitoring software.

The software allows up to four stroke tolerances and eight monitoring windows. It works with all types of presses: manual, servo, pneumatic or hydropneumatic. It’s used extensively in the automotive and medical industries for processes like swaging and pin insertion.
“It also provides a return stroke curve that can be monitored so users can both verify if the part was properly assembled and determine whether or not something happened to the part after the completion of the press operation,” says Zabrosky.
BalTec Corp. is a riveting machine manufacturer. The company first introduced its riveting software in 1998. In August 2009, it introduced the HPP-25 riveting process controller, which offers six control parameters and 39 riveting modes.
Like Schmidt, BalTec’s largest customer is the automotive industry, says Chuck Rupprecht, vice president and general manager. However, that industry’s recession forced the company to expand its customer base. BalTec has moved into the medical industry by enhancing its STF machine so it can more accurately monitor the riveting process for very small parts.
The STF also has an auto compensation feature. Rather than forming every rivet head to a predetermined distance, the machine measures the initial height of the rivet and adjusts the forming stroke to compensate for rivets that are slighlty shorter or longer than expected. This permits greater part-pairing tolerances.
“A California manufacturer is using the machine to make disposable pivot points for finger-like grippers used with a robotic surgical device,” says Rupprecht. “The machine also is being used by an East Coast company to manufacture a spinal insert that is basically a screw in a toggle.”
As for sensors, Nathan Sheaff, CEO of Sciemetric Instruments, says that until the mid-1990s, the technology wasn’t as good as it needed to be. “Getting the proper sensor is very important,” he explains. “If you screw up the sensor, the signature analysis will not work properly.”
“High quality information must be collected before any analysis can be done,” adds Nausley.
Assemblers can use signature analysis to increase accuracy in several common processes, including:
Leak testing. Traditional leak testing measures just the initial pressure and final pressure of a component. In contrast, signature analysis lets assemblers create a pressure vs. time curve that consists of multiple data points throughout the whole process. These detailed data show the leak rate more precisely so assemblers can shorten test time and increase productivity.
Real-world example: Measuring leaking in radiators. Say an assembler makes 100,000 radiators annually. Traditional leak testing determines that a radiator has an initial pressure of 10 psi and a final pressure of 8 psi in a 10-second test cycle. With signature analysis, the company can obtain the same data in an eight-second cycle, saving two seconds or 20 percent. This increased productivity allows the assembler to use two rather than three leak testers to keep up with their assembly line, saving the company a lot of money.
 Torque to turn. Any electromechanical part that is designed to turn
can be tested in this way. The goal is measuring the part’s resistance to
rotary motion to see if it has internal defects.
Torque to turn. Any electromechanical part that is designed to turn
can be tested in this way. The goal is measuring the part’s resistance to
rotary motion to see if it has internal defects.
Real-world example: Testing the quality of an engine crankshaft. The crankshaft is put into an engine block along with the main bearings and spun with an electric motor while measuring the torque required. The resulting process signature indicates rough spots in the rotation, possibly because the crankshaft is bent, or the bearing system isn’t installed correctly.
Crimping. Signature analysis can be used for both linear crimping and rotary crimping. The biggest challenge with either type is finding the right sensor for the application to accurately measure force. In these applications especially, the sensor and signature must be crisp, says Sheaff.
Real-world example: Making sure a medical stent is correctly crimped around the balloon. This rotary-crimping application primarily involves measuring crimp force vs. angle. The signature helps assemblers ensure that the crimping device collapses the diameter of the stent equally all around the balloon’s opening.
 Functional
testing. This is an area where signature analysis is very much
underutilized, says Nausley. In these applications, the goal is to verify that
the assembled component functions as designed. Assemblers can capture data on
many factors related to function: force, torque, position, angle, fluid
pressure, fluid flow and motion control-both linear motion while measuring
force and position, and rotational motion while measuring torque and angle.
Functional
testing. This is an area where signature analysis is very much
underutilized, says Nausley. In these applications, the goal is to verify that
the assembled component functions as designed. Assemblers can capture data on
many factors related to function: force, torque, position, angle, fluid
pressure, fluid flow and motion control-both linear motion while measuring
force and position, and rotational motion while measuring torque and angle.
Real-world example: Ensuring the proper “opening” torque of a car door that features detent springs. The ideal signature shows the hinge requires 28 newton-meters of torque to open, and the control system sets the opening force to that requirement. As each hinge is produced, the control system uses this information to adjust the detent spring preload to match the required 28 newton-meters. In addition, the functional torque can be measured, adjusted and tested all in the same station.
Sound and vibration testing. These two processes are lumped together because sound is usually a derivative of vibration, says Sheaff. Signatures can be taken of any device that vibrates, be it externally or internally, or makes a sound, even though you might not be able to hear it. Vibration signatures are usually measured using either a laser or accelerometer.
Vibration signatures require high-speed sensors because sound is so fast. They typically need to be sampled at a rate of 10 to 30 kilohertz per second. Audio frequencies go up to 20 kilohertz. Also, the software used for signature analysis has to be able to filter out nearby background noise, such as people walking and a forklift moving. The signature analysis system must be capable of frequency domain analysis to be effective in this type of NVH testing.
Real-world example: Determining the cause of clanging noise in an electric motor. This motor is driving a gear with 10 teeth. The signature of the running motor is made using an accelerometer, and its key measurement is frequency. A healthy motor will produce a signature containing 10 clicks, one every 36 degrees. However, the signature indicates nine clicks per revolution, indicating one gear tooth is missing.
 Welding. Signature analysis can be used for both electrical
resistance and ultrasonic welding, both of which occur at tremendous speed.
Data can be obtained as quickly as 1 million samples per second. In either type
of welding, signature analysis lets assemblers get important data related to
the electrical and mechanical aspects of the process.
Welding. Signature analysis can be used for both electrical
resistance and ultrasonic welding, both of which occur at tremendous speed.
Data can be obtained as quickly as 1 million samples per second. In either type
of welding, signature analysis lets assemblers get important data related to
the electrical and mechanical aspects of the process.
Real-world example: Determining the quality of a small wire welded onto a circuit board for a battery. The signature of this resistance weld would include four primary measurements of quality: voltage, amps, compressive force, and the distance between the electrodes. When the wire fuses, the probe distance changes and this is indicated on the signature. This signature also helps assemblers calculate the amount of energy (in joules) dissipated to melt the materials together, and the dynamic resistance to welding, which is the voltage divided by amps.
Ultrasonic welding examples include small items like blood pumps and ink jet cartridges, or large items like gas tanks. However, instead of measuring voltage and amps, the system would measure frequency and amplitude.
Dispense monitoring. Signature analysis can even be applied to the process of dispensing adhesives and sealants. The most common measurements are back pressure of the dispense fluid as it’s forced through a nozzle; auger pressure or angle; and geometry of the fluid bead. Along with temperature, these three measurements provide a composite signature of the dispensed material’s geometry, viscosity and density.
Real-world example: Dispensing consistent medical adhesive for a pacemaker. High-grade silicone is pumped through a hose to a nozzle. A robot moves a nozzle that squirts out a finely metered bead of high-grade silicone around the pacemaker’s perimeter, which is typically just 100-150 mm. To obtain enough information, data points are measured every 0.1 millimeter and form a signature of the dispense process. The signature provides assemblers with crucial information about adhesive quality: whether air bubbles or chunks are present, if it’s stretching, how much is passing by the nozzle, and consistency of viscosity and density.
 Laser
profiling. In this process, a component is moved under a
triangulation laser, which traces the edge of the part and creates a profile
signature of it. The laser measures the part geometrically at very high
accuracy-in micrometers or millimeters-without touching it. Profiling is often
used to verify absence, presence or orientation of parts after
assembly.
Laser
profiling. In this process, a component is moved under a
triangulation laser, which traces the edge of the part and creates a profile
signature of it. The laser measures the part geometrically at very high
accuracy-in micrometers or millimeters-without touching it. Profiling is often
used to verify absence, presence or orientation of parts after
assembly.
Real-world example: Verify that an automobile engine is built correctly. Automotive assemblers need to make sure that valves in the engine are held in place by clips, and that the clips are at the correct angle. The top of the cylinder head on the engine is scanned with a triangulation laser; a bump in the resulting signature confirms the clip is present.
Monitoring powder or slurry compaction. According to Nausley, assemblers can use signature analysis for processes involving powdered metals, magnetic powder, pharmaceutical components and battery chemicals. Measurement factors include fill levels, density levels, expansion forces and volume.
Real-world example: Manufacturing powdered-metal cam lobes for small engines. The cam lobe is formed using very large mechanical presses. Separate signatures of the compression and decompression strokes are created. The compression force vs. position signature provides valuable information regarding fill levels and density of compaction. The decompression stroke signature verifies a good release.
These additional applications have helped signature analysis become more mainstream and acceptable for use in industries besides automotive and medical, such as aerospace, agricultural and energy.
“Some of this growth is driven by new requirements and processes, while some is driven by the crossing over of talent as engineers move from one industry to another,” says Nausley. “Customers are transferring the things that worked for them in their old industries into their new industries.
* Assembly Presses: A Pressing Issue
* Leak Testing Plastics
In this weld signature, the peak to peak of the
distance waveform indicates the combined effect of metals expanding and
melting. Graphic courtesy Sciemetric Instruments.
Until the mid-1990s, press-force monitoring had many more descriptions than applications. Whether it was called load-cell monitoring, pattern recognition or force monitoring, suppliers understood the concept: record a pressing process as a simple force-distance curve and use this information to improve the quality and consistency of component manufacturing and product assembly.
The basic concept of press-force monitoring remains in use, but it has evolved, so to speak, into two branches. One branch still focuses on pressing applications, but offers assemblers more flexibility and precision when capturing information about the force-distance curve.
The other branch has developed into products that let assemblers apply the monitoring concept to applications beyond press force.
In the latter approach, called signature analysis, an assembly process is run while sensors collect dynamic data for as many variables as desired. Software then plots this data instantaneously into a two- or three-dimensional curve, which is the signature of that process.
After several component runs, an ideal signature is developed for that process. Subsequent instances of the process are compared back to this ideal signature, which serves as a benchmark to verify and ensure the repeatability of the process.
“Signature analysis and traditional process monitoring provide 100 percent quality control at the time the components are assembled,” says Dave Zabrosky, North American sales and marketing manager of Schmidt Technology, a supplier of both presses and press-monitoring software.
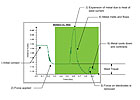
This signature plots data of multiple
measurements taken during a riveting process. Graphic courtesy Promess Inc.
Press Force Gets Updated
Schmidt has offered press monitoring packages since the mid-1990s. The software is based on the traditional force-distance curve, but has a “targeted monitoring” feature to give engineers more flexibility regarding tolerance sizing.The software allows up to four stroke tolerances and eight monitoring windows. It works with all types of presses: manual, servo, pneumatic or hydropneumatic. It’s used extensively in the automotive and medical industries for processes like swaging and pin insertion.
“It also provides a return stroke curve that can be monitored so users can both verify if the part was properly assembled and determine whether or not something happened to the part after the completion of the press operation,” says Zabrosky.
BalTec Corp. is a riveting machine manufacturer. The company first introduced its riveting software in 1998. In August 2009, it introduced the HPP-25 riveting process controller, which offers six control parameters and 39 riveting modes.
Like Schmidt, BalTec’s largest customer is the automotive industry, says Chuck Rupprecht, vice president and general manager. However, that industry’s recession forced the company to expand its customer base. BalTec has moved into the medical industry by enhancing its STF machine so it can more accurately monitor the riveting process for very small parts.
The STF also has an auto compensation feature. Rather than forming every rivet head to a predetermined distance, the machine measures the initial height of the rivet and adjusts the forming stroke to compensate for rivets that are slighlty shorter or longer than expected. This permits greater part-pairing tolerances.
“A California manufacturer is using the machine to make disposable pivot points for finger-like grippers used with a robotic surgical device,” says Rupprecht. “The machine also is being used by an East Coast company to manufacture a spinal insert that is basically a screw in a toggle.”
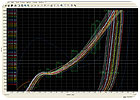
Swaging data for more than 80 parts is provided
in this graphic. Deviant lines indicate bad parts. Graphic courtesy Schmidt
Technology.
Additional Applications
Advances in computers and sensors have enabled signature analysis to become applicable to a wide variety of assembly processes beyond just press force. Glenn Nausley, vice president and general manager of Promess Inc., cites faster data collection, massive memory capacity, lightning-quick number crunching and relatively cheap hardware as key computer advances.As for sensors, Nathan Sheaff, CEO of Sciemetric Instruments, says that until the mid-1990s, the technology wasn’t as good as it needed to be. “Getting the proper sensor is very important,” he explains. “If you screw up the sensor, the signature analysis will not work properly.”
“High quality information must be collected before any analysis can be done,” adds Nausley.
Assemblers can use signature analysis to increase accuracy in several common processes, including:
Leak testing. Traditional leak testing measures just the initial pressure and final pressure of a component. In contrast, signature analysis lets assemblers create a pressure vs. time curve that consists of multiple data points throughout the whole process. These detailed data show the leak rate more precisely so assemblers can shorten test time and increase productivity.
Real-world example: Measuring leaking in radiators. Say an assembler makes 100,000 radiators annually. Traditional leak testing determines that a radiator has an initial pressure of 10 psi and a final pressure of 8 psi in a 10-second test cycle. With signature analysis, the company can obtain the same data in an eight-second cycle, saving two seconds or 20 percent. This increased productivity allows the assembler to use two rather than three leak testers to keep up with their assembly line, saving the company a lot of money.
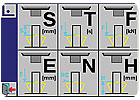
The HPP-25 riveting process controller offers
six physically possible riveting modes. Graphic courtesy BalTec Corp.
Real-world example: Testing the quality of an engine crankshaft. The crankshaft is put into an engine block along with the main bearings and spun with an electric motor while measuring the torque required. The resulting process signature indicates rough spots in the rotation, possibly because the crankshaft is bent, or the bearing system isn’t installed correctly.
Crimping. Signature analysis can be used for both linear crimping and rotary crimping. The biggest challenge with either type is finding the right sensor for the application to accurately measure force. In these applications especially, the sensor and signature must be crisp, says Sheaff.
Real-world example: Making sure a medical stent is correctly crimped around the balloon. This rotary-crimping application primarily involves measuring crimp force vs. angle. The signature helps assemblers ensure that the crimping device collapses the diameter of the stent equally all around the balloon’s opening.
In this graph, eight factors of the
force-distance waveform are recorded. Graphic courtesy Sciemetric Instruments.
Real-world example: Ensuring the proper “opening” torque of a car door that features detent springs. The ideal signature shows the hinge requires 28 newton-meters of torque to open, and the control system sets the opening force to that requirement. As each hinge is produced, the control system uses this information to adjust the detent spring preload to match the required 28 newton-meters. In addition, the functional torque can be measured, adjusted and tested all in the same station.
Sound and vibration testing. These two processes are lumped together because sound is usually a derivative of vibration, says Sheaff. Signatures can be taken of any device that vibrates, be it externally or internally, or makes a sound, even though you might not be able to hear it. Vibration signatures are usually measured using either a laser or accelerometer.
Vibration signatures require high-speed sensors because sound is so fast. They typically need to be sampled at a rate of 10 to 30 kilohertz per second. Audio frequencies go up to 20 kilohertz. Also, the software used for signature analysis has to be able to filter out nearby background noise, such as people walking and a forklift moving. The signature analysis system must be capable of frequency domain analysis to be effective in this type of NVH testing.
Real-world example: Determining the cause of clanging noise in an electric motor. This motor is driving a gear with 10 teeth. The signature of the running motor is made using an accelerometer, and its key measurement is frequency. A healthy motor will produce a signature containing 10 clicks, one every 36 degrees. However, the signature indicates nine clicks per revolution, indicating one gear tooth is missing.
Signature analysis can be applied to the process
of dispensing adhesives and sealants. The most common measurements are back
pressure of the dispense fluid as it’s squirted out a nozzle; vat pressure; and
geometry of the fluid bead. Photo
courtesy Sealant Equipment & Engineering.
Real-world example: Determining the quality of a small wire welded onto a circuit board for a battery. The signature of this resistance weld would include four primary measurements of quality: voltage, amps, compressive force, and the distance between the electrodes. When the wire fuses, the probe distance changes and this is indicated on the signature. This signature also helps assemblers calculate the amount of energy (in joules) dissipated to melt the materials together, and the dynamic resistance to welding, which is the voltage divided by amps.
Ultrasonic welding examples include small items like blood pumps and ink jet cartridges, or large items like gas tanks. However, instead of measuring voltage and amps, the system would measure frequency and amplitude.
Dispense monitoring. Signature analysis can even be applied to the process of dispensing adhesives and sealants. The most common measurements are back pressure of the dispense fluid as it’s forced through a nozzle; auger pressure or angle; and geometry of the fluid bead. Along with temperature, these three measurements provide a composite signature of the dispensed material’s geometry, viscosity and density.
Real-world example: Dispensing consistent medical adhesive for a pacemaker. High-grade silicone is pumped through a hose to a nozzle. A robot moves a nozzle that squirts out a finely metered bead of high-grade silicone around the pacemaker’s perimeter, which is typically just 100-150 mm. To obtain enough information, data points are measured every 0.1 millimeter and form a signature of the dispense process. The signature provides assemblers with crucial information about adhesive quality: whether air bubbles or chunks are present, if it’s stretching, how much is passing by the nozzle, and consistency of viscosity and density.
Traditional leak testing measures just the
initial pressure and final pressure of a component. But signature analysis lets
assemblers create a pressure vs. time curve that consists of multiple data
points throughout the whole process. Photo courtesy Intertech Development Co.
Real-world example: Verify that an automobile engine is built correctly. Automotive assemblers need to make sure that valves in the engine are held in place by clips, and that the clips are at the correct angle. The top of the cylinder head on the engine is scanned with a triangulation laser; a bump in the resulting signature confirms the clip is present.
Monitoring powder or slurry compaction. According to Nausley, assemblers can use signature analysis for processes involving powdered metals, magnetic powder, pharmaceutical components and battery chemicals. Measurement factors include fill levels, density levels, expansion forces and volume.
Real-world example: Manufacturing powdered-metal cam lobes for small engines. The cam lobe is formed using very large mechanical presses. Separate signatures of the compression and decompression strokes are created. The compression force vs. position signature provides valuable information regarding fill levels and density of compaction. The decompression stroke signature verifies a good release.
These additional applications have helped signature analysis become more mainstream and acceptable for use in industries besides automotive and medical, such as aerospace, agricultural and energy.
“Some of this growth is driven by new requirements and processes, while some is driven by the crossing over of talent as engineers move from one industry to another,” says Nausley. “Customers are transferring the things that worked for them in their old industries into their new industries.
ASSEMBLY Online
For more information on signature analysis, be sure to check out the following articles:* Assembly Presses: A Pressing Issue
* Leak Testing Plastics
Looking for a reprint of this article?
From high-res PDFs to custom plaques, order your copy today!


