Special Report: State of the Profession 2016
New tools and technologies help level the playing field.
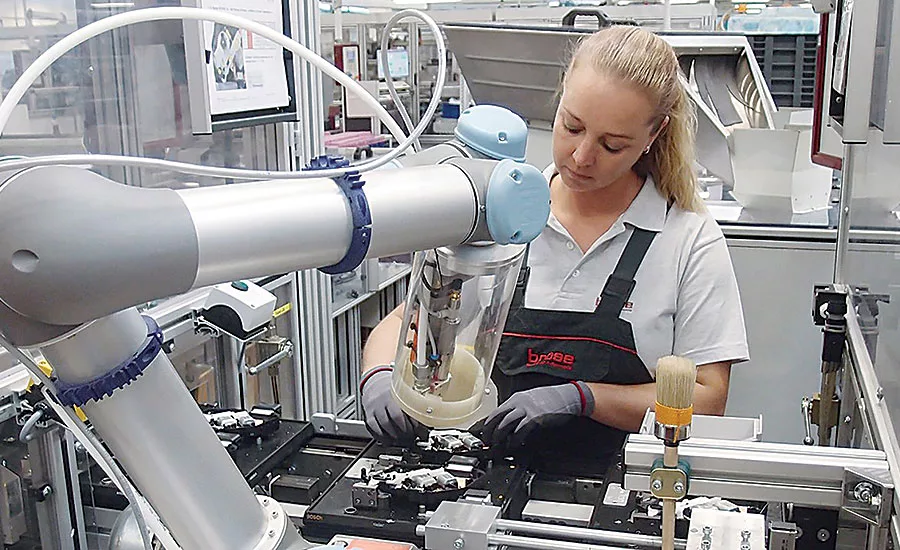
Next-generation machines equipped with state-of-the-art sensor technology allow robots to operate side-by-side with humans on assembly lines. Photo courtesy Brose North America Inc.
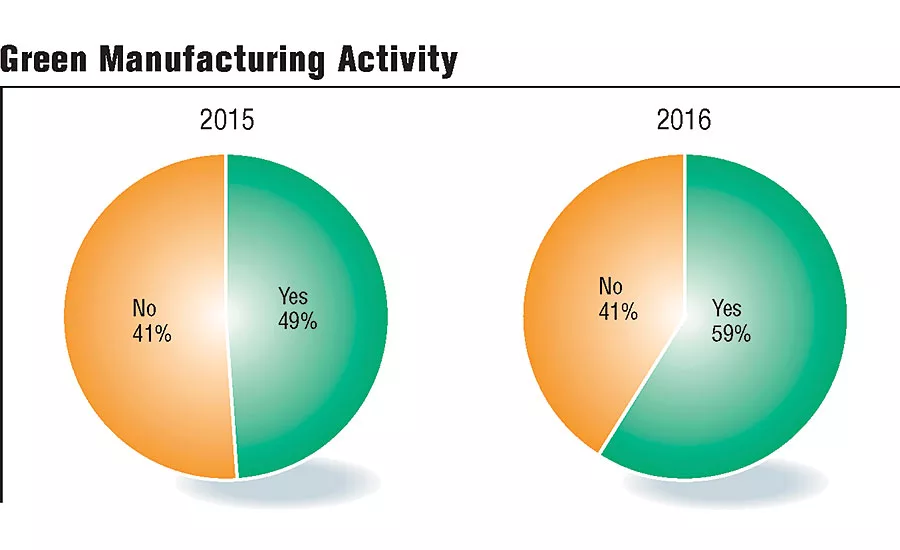
Green Manufacturing Activity
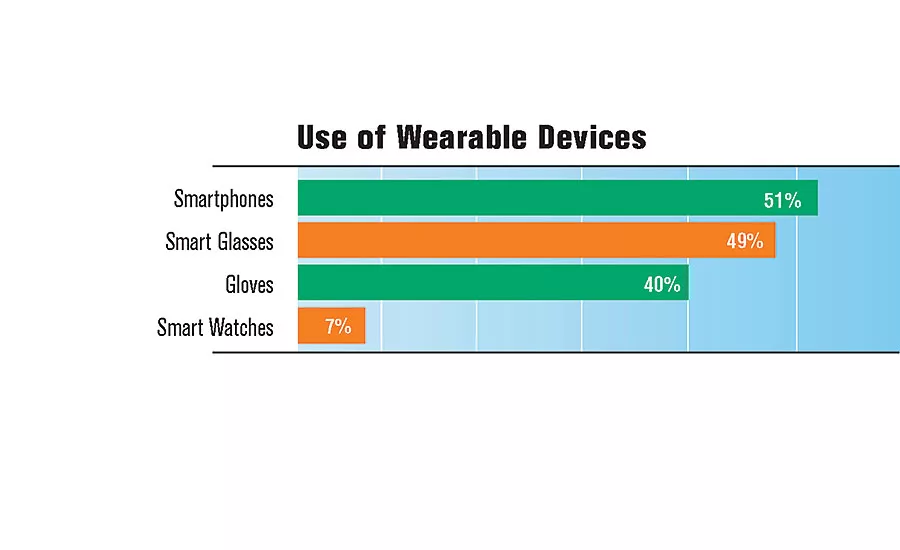
Use of Wearable Devices
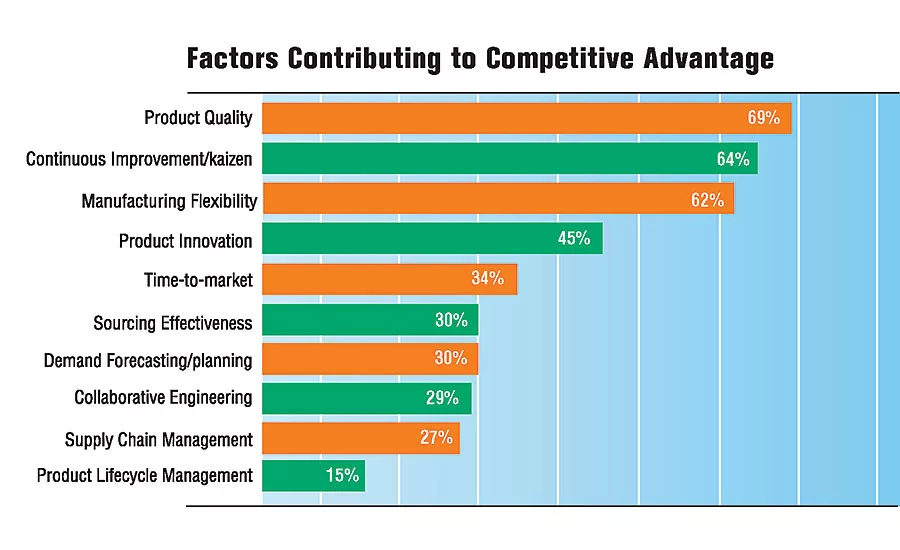
Factors Contributing to Competitive Advantage
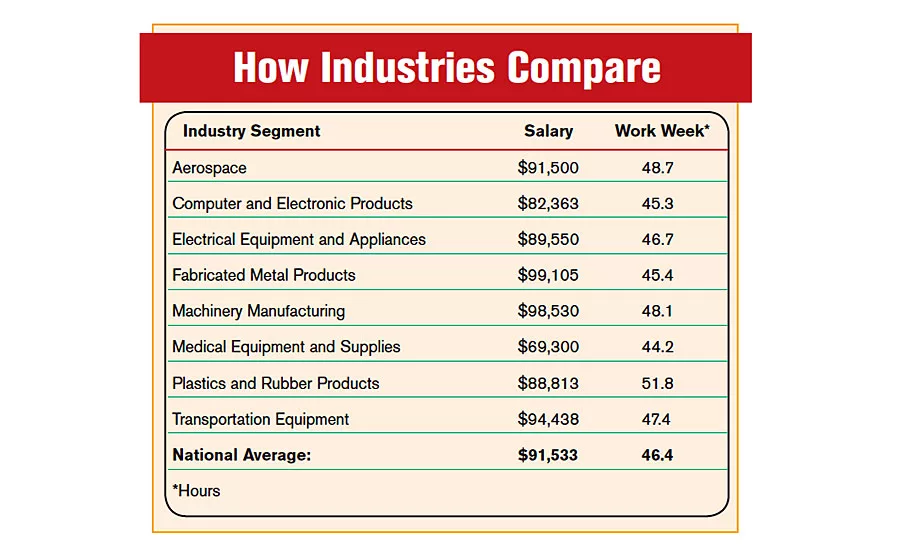
How Industries Compare

Geography Affects Compensation
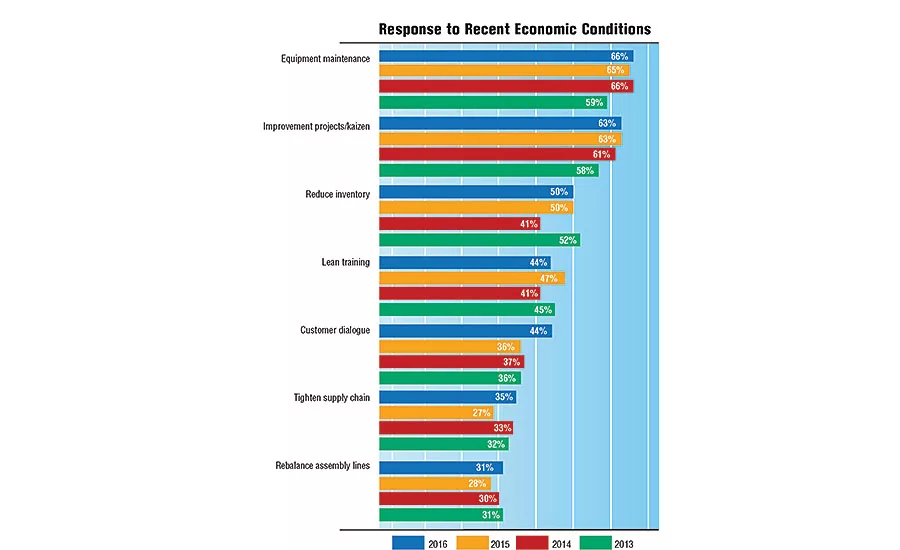
Response to Recent Economic Conditions
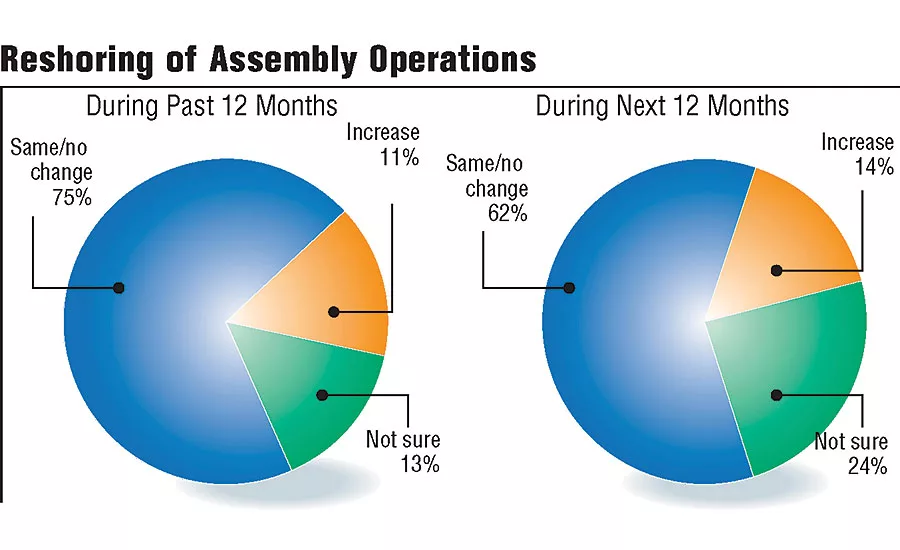
Reshoring of Assembly Operations
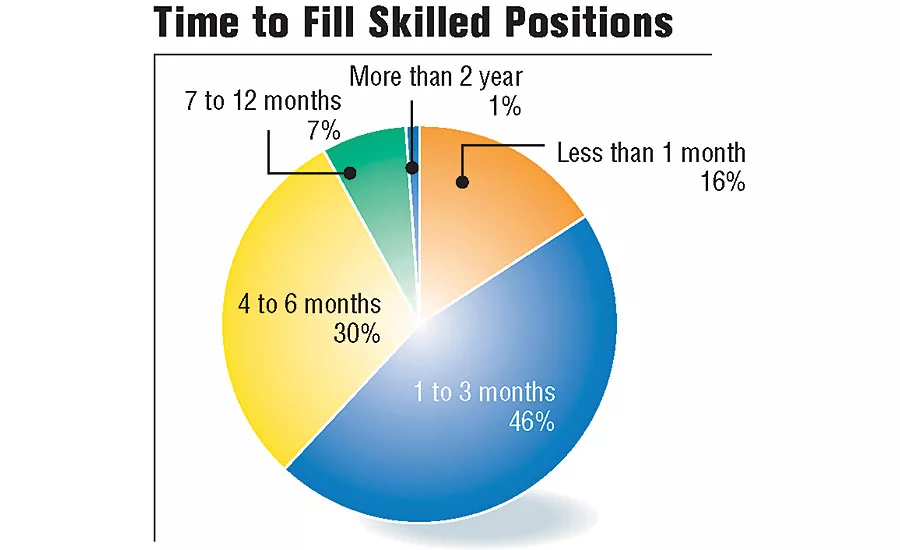
Time to Fill Skilled Positions
Manufacturing today is leaner and greener than ever. Many engineers are focusing on lightweight materials and sustainable production initiatives. In addition, additive manufacturing is transforming how a wide variety of products are designed and assembled.
Those trends are forcing manufacturers to invest in new tools and technologies ranging from collaborative robots to wearable devices. In fact, the 21st annual ASSEMBLY State of the Profession survey finds that more than one out of three companies (42 percent) will be allocating more resources toward assembly operations during the next 12 months.
More than one-half (59 percent) of respondents claim their plant has implanted green manufacturing programs, such as energy-efficient lighting, within the last 12 months. That’s a 10 percentage point increase over 2015. Use of additive manufacturing technology is up 6 percentage points, while use of lightweight materials is up 3 percentage points.
Not surprisingly, overall job satisfaction levels are at the highest they’ve ever been. More than one-half (52 percent) of assemblers claim they are “highly satisfied,” which is 3 percentage points higher than 2014 and 7 percentage points higher than 2013. Only 4 percent claim they are “not satisfied.”
Eleven percent of assembly professionals report that their company reshored assembly operations during the last year. And, 14 percent expect their employer to bring work back to the states during the next 12 months, which is a 2 percentage point increase over 2015.
In addition, 23 percent of respondents work for companies that plan to expand existing facilities or build new assembly plants during the next 12 months. Construction activity will be strongest in the transportation equipment industry (42 percent), followed by plastics and rubber (40 percent) and aerospace (26 percent).
Large manufacturers (companies with 2,000 or more employees) will be building the most infrastructure (42 percent vs. 16 percent of small manufacturers). Almost one-third (32 percent) of respondents in the West anticipate plant expansions during the next 12 months, followed by the Midwest (29 percent), South (19 percent) and Northeast (11 percent).
Looking for quick answers on assembly and manufacturing topics? Try Ask ASM, our new smart AI search tool. Ask ASM
The optimistic results of the 2016 State of the Profession report are backed up by several studies conducted by other organizations.
The United States currently sits just behind China in terms of manufacturing competitiveness, and is expected to overtake that country by 2020, according to a recent study by consulting firm Deloitte Touche Tohmatsu and the Council on Competitiveness.
“The United States improved its ranking from fourth in 2010 and now ranks highest as an advanced manufacturing economy,” claims Deborah Wince-Smith, president and CEO of the Council on Competitiveness. “The country is highly competitive in terms of its share of high skill and technology contribution to exports and labor productivity as measured by gross domestic product.
“Made in the USA is making a big comeback,” adds Wince-Smith. “Contrary to the view that manufacturing is dirty, dumb, dangerous and disappearing, our study points to a manufacturing future characterized by innovation-driven growth. Manufacturing is sustainable, smart, safe and surging. And, America will lead the world in this transformation.”
“Just as the competitive landscape is changing for U.S. manufacturers relative to their foreign counterparts, so is the market environment for manufactured goods,” notes Jacob Prak, CEO of Michigan Manufacturing International, which supplies bearings, gears, machined parts, mechanical assemblies, stampings and other types of fabricated metal components to manufacturers in a wide variety of industries. “Design and manufacturing are becoming simultaneously more automated and more flexible.
“Real-time information gathering and analysis are allowing factories to react immediately to changes in conditions or requirements,” notes Prak. “Continued improvements in design tools permit them to more easily interface with production equipment. This has shortened the time and effort required to get from concept to production.
“One of the main results of these changes is that short production runs of high-quality products have become possible, while long-run production is reaching quality and efficiency standards that were not possible even a few years ago,” claims Prak. “Conversely, for simple, undemanding, manufactured goods, there has been a democratization of the production process that either has or will drive out established producers.”
“I have great confidence in the future of manufacturing,” adds Jay Timmons, president and CEO of the National Association of Manufacturers. “Our shop floors are no longer the factories of our parents’ generation; they are state-of-the-art facilities driving an innovation revolution that will change our lives and strengthen our country.”
Economic Roller Coaster
The MAPI Foundation, the research affiliate of the Manufacturers Alliance for Productivity and Innovation, forecasts manufacturing production growth of 2.6 percent in 2016, 3 percent in 2017 and 2.8 percent in 2018. Factors such as a strong U.S. dollar, falling commodity prices and risk aversion have not dissipated and are the cause of this slow growth.
“The sector’s erratic pattern of surges and declines isn’t providing a solid footing for expansion,” says Daniel Meckstroth, Ph.D., MAPI chief economist. “Manufacturing is facing a number of challenges, including high inventories, collapsing oil prices, an unwillingness to invest, and an appreciating dollar that makes exports more expensive to foreign buyers.
“Strong employment growth amid little inflation boosts consumer income and spending,” explains Meckstroth. “Another impetus is easy credit availability, which propels big-ticket spending for motor vehicles, residential housing and nonresidential construction.
“Motor vehicle and housing supply chains are the driving force offsetting the deep recession in mining and energy capital spending, and the pervasive drag of a strong dollar,” Meckstroth points out. “The 2016 outlook is helped by the absorption of the negative shocks in 2015, such as the severe winter that disrupted transportation and shut down plants.
“There will not be another West Coast port strike, and oil and gas prices will not drop by half again [this] year,” notes Meckstroth. “And, while the dollar may appreciate somewhat in 2016, it will not surge 15 percent again. The absence of these negative shocks provides some positive momentum.”
ASSEMBLY’s 2016 State of the Profession study was conducted in March, as the manufacturing sector experienced mixed news. On one hand, the U.S. Department of Labor reported that the sector lost 23,000 jobs since the start of the year. And, the National Association of Home Builders (NAHB) claimed that demand for new housing fell 9 percent in March.
“Single-family starts [were] off from their strong showing in February, but this slowdown represents a return to a long-run, gradual growth trend that is consistent with builder confidence levels, which are overall positive,” says Robert Dietz, NAHB chief economist.
At the same time, there were bright signs for manufacturers during the first quarter. For instance, AMT’s U.S. Manufacturing Technology report for March showed that orders grew 37 percent compared to the previous month. However, orders were down 12 percent compared to March 2015.
“While dealing with persistent economic challenges and a softer market that’s likely to last into the fourth quarter, manufacturers are leveraging productivity gains to stay competitive,” says Douglas Woods, AMT president. “The outlook from industry economists improves toward year’s end on two particular strengths of the U.S. economy: foreign direct investment and a resurgent consumer base.
“For now, manufacturing technology makers are focused on finding markets that offer the best opportunity, like automotive, aerospace and medical,” Woods points out. “Sentiment among manufacturing executives remains optimistic about future capital equipment investment.”
A majority (90 percent) of respondents to ASSEMBLY’s survey expect their company to commit either the same amount or more resources toward operations during the next 12 months. Manufacturers in the transportation sector, which includes automobiles, car parts, motorcycles, recreational vehicles and trucks, are the most optimistic. Indeed, 51 percent of those assemblers claim their companies will be committing more resources toward improving operations.
Auto Production Accelerates
Auto sales continued to surge during the first quarter. That was on top of a record-setting 2015, when 17.5 million cars and trucks were sold in the United States.
“New-vehicle sales for cars and light trucks are on pace to reach 17.7 million vehicles,” claims Steven Szakaly, chief economist at the National Automobile Dealers Association.
According to Szakaly, the average transaction price on a new vehicle was nearly $34,000 at the end of the first quarter, thanks to an increase in light-truck sales and the purchase of more options on vehicles.
“With low interest rates, low gasoline prices and a rich selection of new vehicles with improved fuel and safety technology, it remains a great time for consumers to buy a car,” says Szakaly.
Low fuel prices are also helping to accelerate a long-term trend in U.S. motor vehicle sales that continues to favor light trucks over cars. “We expect light trucks to reach 57 percent of the new-car market this year,” notes Szakaly.
Some industry observers are even more bullish. IHS Automotive predicts there’s still tremendous upside potential as a strengthening U.S. economy and stronger employment rates push demand to 18 million units.
“The U.S. auto market has been powered by a combination of low interest rates and low gas prices, allowing for market momentum to remain strong,” explains Henner Lehne, senior director of global light vehicle forecasting at IHS Automotive. “Although interest rates will be a slight headwind, buying conditions will remain positive, allowing the market to continue to grow in 2016 and 2017.”
John Murphy, senior automotive analyst at Bank of America Merrill Lynch, believes the auto industry will remain strong for at least two more years. In fact, he’s forecasting 18.2 million units for 2016, followed by 19 million in 2017 and 20 million in 2018. Murphy bases his bullish outlook on replacement cycles—the average vehicle in the U.S. is 11 years old.
Over the next three years, automakers also plan to ramp up the speed at which they replace models. According to Murphy, 58 percent of the new vehicles launched in the U.S. between now and the end of the decade will be cars or sport utility vehicles. That’s up from 49 percent over the last 10 years.
The number of vehicle launches will average 58 a year from 2017 to 2020. That’s in sharp contrast to an average of 38 new vehicle launches annually between 1997 and 2016.
By 2020, Murphy claims that new vehicles will be on sale at U.S. dealer showrooms for an average of two years since a model was last launched or redesigned, down from three years in 2016.
That’s why automakers and suppliers are pouring millions of dollars into their assembly plants. According to the State of the Profession study, 42 percent of assemblers in the transportation sector work for companies that are expanding current facilities or building new plants.
Ford Motor Co. is investing $9 billion in its U.S. manufacturing facilities. Factories scheduled to receive upgrades include the Cleveland Engine Plant, the Kentucky Truck Plant, the Livonia Transmission Plant and the Ohio Assembly Plant. However, the automaker has come under some criticism for building a new assembly plant in Mexico that will produce small cars.
Tier One suppliers are also investing in new facilities to boost productivity, improve throughput and address quality concerns. Dana Corp. is building a $70 million Jeep axle plant in Toledo, OH. Flex-N-Gate is investing $95 million in a new plant in Detroit that will supply Ford Motor Co.
Although the automotive industry has been rewriting the production record books lately, it’s also plagued with more quality problems than ever. And, quality continues to be a concern for manufacturers in all industries.
More than two-thirds (69 percent) of State of the Profession respondents are currently dealing with issues relating to quality. In addition, more than one-half (55 percent) of respondents claim that product quality will be the biggest challenge to their companies’ success during the next 12 months. That’s 2 percentage points higher than in 2015.
Product quality is more important to large manufacturers (companies with more than 2,000 employees) than small manufacturers (companies with fewer than 100 employees). Three-fourths (75 percent) of large companies are struggling to address product quality vs. only 54 percent of assembly professionals at small manufacturers.
Sixty-four 64 percent of assemblers in the transportation equipment industry are concerned with quality-related issues, followed by electrical equipment and appliances (61 percent) and fabricated metal products (59 percent).
Last year was record-setting both in the number of autos recalled and recall campaigns. According to the National Highway Traffic Safety Administration, 51 million vehicles were recalled in 2015, slightly more than the 2014 total. There were almost 900 separate recall actions, nearly 100 more than the previous year.
Takata air bag inflators were linked to approximately 42 percent of all recalled vehicles last year. The largest non-Takata recall of 2015 was issued by Toyota, related to a power window electrical switch that could short-circuit and potentially catch fire. It affected more than 1.8 million vehicles.
“[The auto industry is] on the cusp of a new era of heightened recall activity,” says Neil Steinkamp, managing director at Stout Risius Ross Inc. (SRR), which conducts an annual study on the topic. “A major characteristic of this new era is the impact of software and wireless technology.”
According to SRR’s analysis, software-related recalls have risen sharply in recent years. In 2011, less than 5 percent of all recalls were software-related. By the end of 2015, the rate had risen to 15 percent.
“Today’s cars can contain over 100 million lines of code,” claims Steinkamp. “For perspective, an F-35 joint strike fighter jet contains about 9 million. When you have that much software in a car—and particularly when much of that software is relatively new—there are going to be some issues.”
According to Steinkamp and other experts, manufacturing-related recalls are directly related to the growing complexity of vehicles.
“When as few as four extra options are added on an assembly line, it can lead to two extra recalls,” explains Rachna Shah, associate professor of supply chain and operations at the Carlson School of Management at the University of Minnesota, who recently conducted a study on the subject.
“Switching between different tasks to install options within a short period of time adds complexity to workers’ job tasks,” adds Shah. “It also affects quality inspectors, who, under increased pressure, miss mistakes.”
Compensation Variables
The typical State of the Profession respondent is 54 years old, has 24 years of experience and earns $91,533. However, there are exceptions at both the high and low ends of the scale. For instance, 22 percent of respondents take home less than $65,000 per year, while 40 percent earn more than $95,000.
On average, men earn 24 percent more than women. And, more than one-quarter (27 percent) of women respondents earn less than $60,000 vs. 16 percent of men.
Part of this discrepancy is due to the fact that women make up 47 percent of the U.S. labor force, but only 27 percent of the country’s manufacturing workforce.
Many female respondents to ASSEMBLY’s survey also have less experience than their male counterparts. Women represented only 6 percent of respondents and had an average of 14 years of experience vs. 25 years for men. In fact, more than three-quarters (82 percent) of men have more than 15 years of experience in the assembly field, while 37 percent of women have less than 15 years of experience.
In addition to gender, several other factors determine pay rates, such as age, education, experience, location and type of industry.
Industry experience is the biggest factor that determines compensation. Individuals with more than 25 years of experience (48 percent of respondents) earn more than assemblers with less than 15 years of experience in the assembly field (29 percent of respondents).
Assembly professionals tend to be loyal employees who stay with the same company for many years. In fact, 40 percent of respondents have worked at the same firm for more than 10 years, while 20 percent have been with their present employer for less than three years.
More than one-half (56 percent) of ASSEMBLY’s respondents received a pay increase over the last 12 months. However, 8 percent experienced a decrease in salary. Salary raises varied widely, but the average increase was 5 percent, which is 1 percentage point higher than in 2015.
Forty-eight percent of respondents received a cash bonus during the last 12 months. Bonuses were typically tied to overall company and plant performance, in addition to implementing successful cost reduction programs, meeting deadlines for new projects and launching new products.
Two-thirds (67 percent) of assemblers who work in the machinery manufacturing industry received a cash bonus during the past year, followed by assemblers in the fabricated metals (65 percent) and transportation equipment (52 percent) industries.
More than one-half (56 percent) of assembly professionals will probably receive a salary increase at their next review. Assemblers in the computer and electronics industry feel most confident about receiving a raise in the near future. Indeed, 82 percent of those individuals say they expect a raise, followed closely by assemblers in the aerospace industry (78 percent).
However, respondents who work for contract manufacturers are less optimistic. Only 20 percent of them expect to receive an increase in their salary during the next 12 months.
Assemblers who work for larger manufacturers (1,000 or more employees) are more likely to receive a raise during the next 12 months than those employed by companies with less than 100 employees. More than one-half (63 percent) of respondents at large companies also expect to get a cash bonus vs. 52 percent of assemblers at small manufacturers.
Geographic Discrepancy
Assembly salaries typically fluctuate from region to region, due to the local cost of living. For instance, a house that is $300,000 in Peoria, IL, can cost at three times that much in the suburbs of Chicago.
The Northeast (Connecticut, Maine, Maryland, Massachusetts, New Hampshire, New Jersey, New York, Pennsylvania, Rhode Island and Vermont), which is home to 19 percent of State of the Profession respondents, boasts the highest salaries—an average of $106,135.
On the other hand, assemblers in the South (Alabama, Arkansas, Delaware, Florida, Georgia, Kentucky, Louisiana, Maryland, Mississippi, North Carolina, Oklahoma, South Carolina, Tennessee, Texas, Virginia and West Virginia), which is home to 26 percent of respondents, average $84,378.
Assemblers in the West (Arizona, California, Colorado, Idaho, Montana, Nevada, New Mexico, Oregon, Utah, Washington and Wyoming), which is home to 16 percent of respondents, average $102, 964.
With an average salary of $87, 685, the Midwest most closely resembles the national average of $91,533. That region, which is home to 39 percent of respondents, includes Illinois, Indiana, Iowa, Kansas, Michigan, Minnesota, Missouri, Nebraska, North Dakota, Ohio, South Dakota and Wisconsin.
Only 30 percent of assembly professionals in the South earn more than $100, 000 vs. 59 percent of assemblers in the West.
Assemblers in the West tend to work two hours a week less than the national average of 47 hours. And, only 7 percent of respondents in the West expect to work more hours during the next 12 months vs. 30 percent of assemblers in the South.
Assembly professionals in the Northeast tend to be more satisfied than their peers in other parts of the country. More than two-thirds (67 percent) claim to be “extremely satisfied” vs. 39 percent of assemblers in the South.
The size of a manufacturer typically determines compensation levels. For instance, assembly professionals at small manufacturers (companies with less than 100 employees) earn an average of $81,918. Assemblers who work in companies with more than 2,000 employees earn an average of $94,263.
But, assemblers who work for smaller firms tend to be much happier (62 percent) than people who work for big companies (42 percent).
Assembly professionals in the fabricated metal products sector receive higher salaries than their peers in other industries. For instance, they earn 8 percent more than the national average of $91,533. Assemblers in the machinery, aerospace and transportation equipment industries also receive higher-than-average compensation.
Manufacturing engineers (21 percent of respondents) earn more than design engineers (9 percent of respondents). According to the 2016 State of the Profession survey, manufacturing engineers earn an average of $87,233 vs. $75,756 for design engineers.
Age is another important factor that affects compensation. For instance, assembly professionals who are more than 50 years old (72 percent of respondents) typically earn the highest salaries. They average $91,801 vs. assemblers who are under 40 (15 percent of respondents), who earn an average of $77,245.
Salaries also fluctuate widely based on type and level of education. For example, assembly professionals with just a bachelor’s degree (34 percent of respondents) earn an average of $88,517. However, assemblers who’ve earned a master’s degree (19 percent of respondents) earn $99,781.
Obtaining a master’s in business administration (MBA) or a lean-six sigma black belt is a good way to ensure a higher salary. Assemblers with MBAs (15 percent of respondents) earn an average of 18 percent more than non-MBAs. Assemblers with black belts (9 percent of respondents) earn an average of 17 percent more than others.
Time Marches On
Assemblers work an average of 46 hours a week. In fact, two-thirds (67 percent) of 2016 State of the Profession respondents often work more than 45 hours a week. People in the plastics and rubber industry tend to spend the most time at work (an average of 52 hours per week), while assembly professionals in the medical equipment and supplies industry work less (an average of 44 hours per week).
Eighteen percent of assemblers claim that their average work week will increase during the next 12 months, which is 4 percentage points higher than in 2015. More than one-third (40 percent) of assembly professionals who work for contract manufacturers expect to work more hours during the next 12 months, followed by assemblers in the machinery sector (27 percent).
Assemblers at small manufacturers plan to spend more time at work than their counterparts at larger companies. Twenty percent of respondents who work for manufacturers with less than 100 employees expect to work more in the next 12 months. However, only 9 percent of assemblers who work for companies with more than 1,000 employees expect to experience longer work weeks.
Smartphones and other portable electronic devices may be partially to blame for those extra-long hours. Many company-issued devices are blurring the lines between workday and off hours. However, personal devices are also contributing to wasted time at work.
“While technology helps workers stay connected while away from the office, in many cases it is causing them to disconnect while in the office, leading to a negative impact on productivity,” says Rosemary Haefner, chief human resources officer at CareerBuilder LLC, which recently conducted a study on the topic.
“More than eight in 10 workers have smartphones and keep them within eye contact at work,” claims Haefner. “While we need to be connected to devices for work, we’re also a click away from alluring distractions from our personal lives, like social media and various other apps.”
Despite having many digital tools available, the majority (63 percent) of participants in ASSEMBLY’s study say that they are doing the same amount of work-related travel today vs. one year ago. In fact, 22 percent of assemblers claim they are doing more travel, which is 6 percentage points higher than in 2015 and 10 percentage points higher than in 2014.
More than one-half (56 percent) of respondents also believe that time constraints will affect their ability to do their jobs during the next 12 months. Time-related pressure will pose the biggest challenge to assemblers who work for contract manufacturers (73 percent), computer and electronics (65 percent) and transportation equipment (60 percent) manufacturers.
Assembly professionals at large manufacturers (companies with 1,000 or more employees) are under more pressure to watch the clock than people who work for small manufacturers (companies with less than 100 employees). Indeed, two-thirds (69 percent) of respondents at large companies cite time constraints as a challenge vs. only 49 percent of assemblers who work at small firms.
In addition to time management, assembly professionals will spend more time on manufacturing flexibility (62 percent) in the near future, which is 3 percentage points higher than in 2015.
A majority (74 percent) of respondents in the fabricated metal products industry will be focusing on making their assembly lines more flexible during the next 12 months. Other industries tackling flexibility issues include aerospace (70 percent), machinery (67 percent), transportation equipment (62 percent) and medical equipment (61 percent).
Productivity Tools
More and more manufacturers are equipping assemblers with state-of-the art technology to address time constraints and boost productivity. In fact, 7 percent of State of the Profession respondents plan to deploy smart glasses, smartphones and other devices on the plant floor in the next 12 months.
Wearable technology allows workers to access important information, such as work instructions, with just voice commands. This allows them to stay at their workstations and be more productive.
Large manufacturers (19 percent) are more likely to deploy wearable technology vs. only 3 percent of small manufacturers.
Smartphones are popular with more than one-half (51 percent) of assemblers. Other wearable technology being deployed on assembly lines include smart glasses (49 percent), gloves (40 percent) and watches (7 percent).
Twelve percent of assembly professionals in the aerospace industry plan to follow the lead of Airbus and Boeing by investing in wearable devices. Other industries eager to use the technology include transportation equipment (8 percent) and fabricated metal products (8 percent) manufacturers.
Tractica LLC predicts that worldwide shipments for industrial wearables will increase from 2 million in 2015 to 66 million units annually by 2021. “[Workplace wearables] continue to see high levels of interest and market momentum as companies across a wide variety of industry sectors conduct trials and plan deployments with a diverse set of devices,” says Aditya Kaul, research director at Tractica.
Airbus engineers have developed “connected glasses” for assemblers to wear on the A330 jetliner final assembly line in Toulouse, France. The glasses enable cabin assembly personnel to designate the exact location where seats and other cabin furnishings should be affixed inside the aircraft, without having to constantly refer to printed documents.
The head-worn technology features a camera to scan barcodes so the user can see the specific cabin plans and information based on individual customer requirements, as well as view the marking zone. The glasses also feature an offset screen that displays several navigation icons and items in augmented reality.
In addition, when the mark has been made, its location is checked by the tool to validate the operation. Interactivity with the hands-free technology is provided via voice recognition.
Engineers at Ford Motor Co.’s assembly plant in Valencia, Spain, have developed a wearable device that enables operators to make faster and more accurate quality checks.
Previously, assemblers used a paper-based system that involved walking back and forth to access information on desktop PCs. Now, using a wrist-worn quality assurance device, specification and quality checks can be made on the spot.
“The ability to simply consult a smartphone screen to check any aspect of a vehicle’s quality helps improve work processes and manufacturing efficiency,” says Linda Cash, vice president of manufacturing at Ford of Europe.
“The new system has helped reduce human error by 7 percent, while at the same time making each vehicle check seven seconds quicker,” claims Cash. “This represents a substantial time saving that allows additional quality inspections.”
In the United States, several prominent manufacturers are deploying wearable devices on their assembly lines. For instance, Boeing has used Google Glass technology to improve wiring harness assembly applications. At its oxygen sensor plant in Anderson, SC, Bosch has equipped assemblers with smartwatches.
Deere & Co. is currently conducting tests at several of its plants. Applications are focusing on how wearables can improve the efficiency and productivity of assemblers by reducing errors, improving safety and boosting quality.
Assembly professionals are also busy deploying other cutting-edge tools, such as 3D printers and collaborative robots.
Additive manufacturing continues to move beyond traditional prototyping applications and into low-volume production. More than one-third (37 percent) of State of the Profession respondents plan to use 3D printing technology during the next 12 months. That’s a 7 percentage point increase over 2015.
Interest is strongest in the medical equipment (56 percent), transportation equipment (55 percent), computer and electronics (53 percent) and aerospace (52 percent) industries.
“Digital technology is transforming manufacturing processes across the entire product life cycle,” says John Dulchinos, vice president of digital manufacturing at Jabil Circuit Inc. “3D printing is an important pillar of [our] digital strategy.”
According to Dulchinos, the former president and CEO of robotics pioneer Adept Technology Inc., the factory floor of the future will also be smarter than in the past. He believes collaborative robots will enable manufacturers to tackle many high-mix production challenges that were impossible in the past.
The next-generation machines equipped with state-of-the-art sensor technology allow robots to operate side-by-side with humans on assembly lines. There’s no need for traditional safety barriers and protective cages.
More than one-quarter (26 percent) of State of the Profession respondents expect to deploy collaborative robotic technology during the next 12 months.
One-half (51 percent) of manufacturers in the transportation equipment sector plan to follow the lead of Audi, Brose and other companies and invest in the machines. Other industries eager to allow humans and robots to work in close proximity on assembly lines include fabricated metal products (42 percent), computer and electronic products (37 percent) and contract manufacturers (35 percent).
Large manufacturers (54 percent) are more likely to deploy collaborative robotic technology vs. only 43 percent of small manufacturers.
About the Industries
Participants in the 2016 State of the Profession survey were comprised of the following industry segments, based on the North American Industry Classification System:
Aerospace: includes airplanes, helicopters, jet engines, missiles, rockets and satellites.
Computer and Electronic Products: includes antennas, audiovisual equipment, automatic teller machines, clocks, computers and peripherals, connectors, digital cameras, flat-panel displays, loaboratory instruments, loudspeakers, navigational instruments, printed circuit boards, process control instruments, railroad signaling equipment, semiconductors, smoke detectors, stereos, telephone apparatus, televisions, test and inspection equipment, transmitters, video recorders and watches.
Contract Manufacturing: includes third-party companies that manufacture components, subassemblies or complete products for other companies.
Electrical Equipment and Appliances: includes batteries, flashlights, generators, household appliances, industrial controls, lamp bulbs, lighting fixtures and equipment, motors, switches and transformers.
Fabricated Metal Products: includes ammunition, cans and containers, cutlery, doors, fences, firearms, hand tools, hinges, ladders, locks, metal stampings, plumbing fixtures, prefabricated buildings, springs, valves and windows.
Machinery Manufacturing: includes agricultural equipment, construction equipment, conveyors, food processing machinery, lawn and garden equipment, machine tools, office machines, packaging machinery, photographic equipment, printing presses, power tools, pumps and compressors, refrigeration and heating equipment, textile machinery, vending machines and welding equipment.
Medical Equipment and Supplies: includes diagnostic equipment, orthopedic and prosthetic appliances, and surgical instruments.
Plastics and Rubber Products: includes belts, bottles, floor coverings, hoses, packaging materials, pipes and fittings, plumbing fixtures and tires.
Transportation Equipment: includes automobiles and automotive components, boats, engines, motor homes, railroad locomotives and rolling stock, recreational vehicles, ships, trailers and trucks.
Survey Methodology
ASSEMBLY magazine would like to thank all the respondents who participated in its 21st annual State of the Profession survey. The survey was conducted online in March 2016 by BNP Media’s market research division. It was sent to more than 29,000 randomly selected subscribers with an e-mail address.
The charts and tables in this report highlight the major data gleaned from the survey responses. On some of the questions, the response rate does not equal 100 percent due to rounding or surveys that contained one or more unanswered questions. In cases where multiple responses were allowed, the total may exceed 100 percent.
Special thanks to Cody Hall and Doris Wu for their assistance with online survey design, distribution and tabulation.
Looking for a reprint of this article?
From high-res PDFs to custom plaques, order your copy today!


