Statistical Process Control of Torque Data on Assembly Lines
Power tools collect a wealth of data about the fastening process, but what can engineers learn from it?
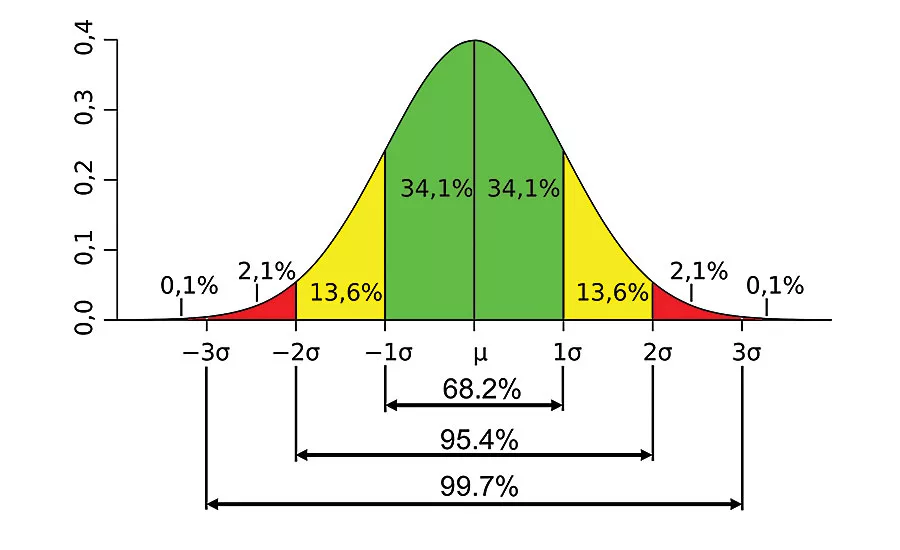
In a histogram of torque data, the area under the curve that lies within one standard deviation of the mean represents 68 percent of all torque readings in the data set. The area within two deviations represents 95 percent of all readings, and the area within three deviations represents 99.7 percent of all readings. Illustration courtesy Kanbanize Inc.
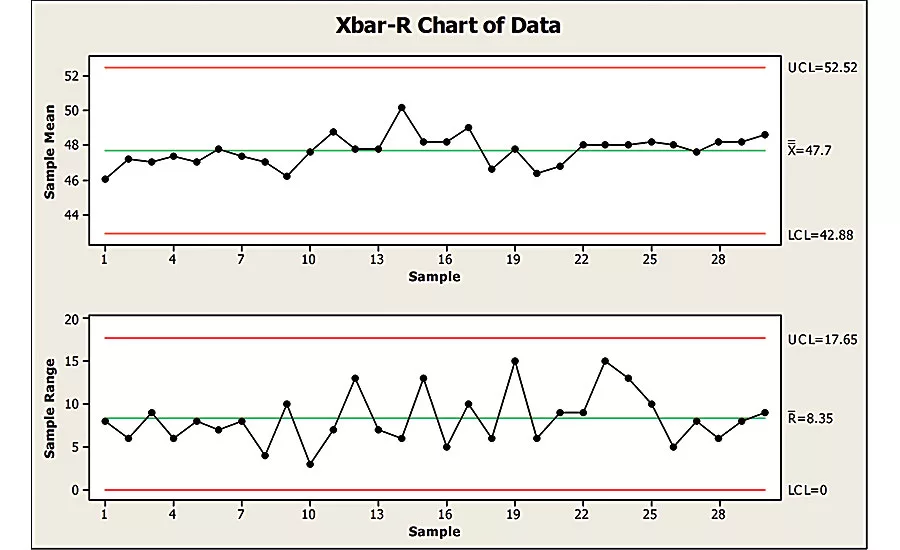
X-bar and R charts can identify fastening problems quickly by comparing samples of torque and angle data to your overall results. Illustration courtesy Minitab Inc.
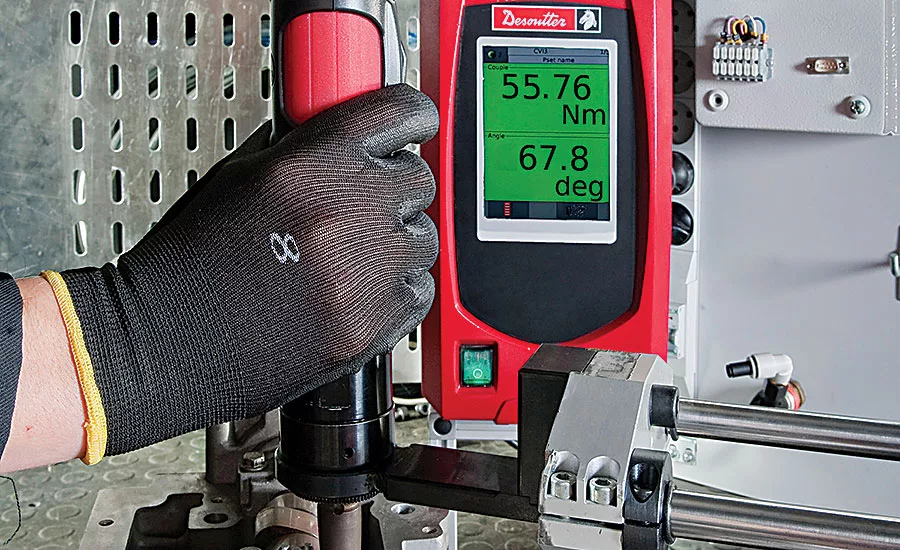
Power tools collect a wealth of data about the fastening process. Photo courtesy Desoutter Industrial Tools
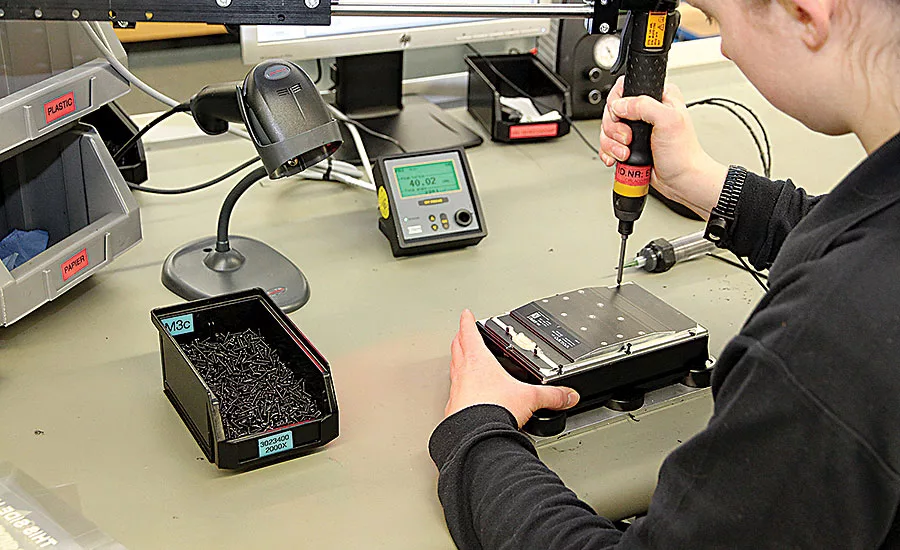
No matter how accurate the tool, there will always be some variation in how much torque is applied to a fastener. Photo courtesy Atlas Copco Tools and Assembly Systems
Power tools collect a wealth of data about the fastening process. With some simple statistical analysis, engineers can obtain valuable insight into the fastening process.
No matter how accurate the tool, there will always be some variation in how much torque is applied to a fastener. Myriad factors influence the process. Variation in air pressure, friction, part dimensions, operator skill and other factors means that one fastener will be slightly tighter or looser than the next. Statistical analysis can tell engineers when such variation is unacceptable.
One way to look at fastening data is with a histogram, a bar graph that indicates how often certain values occur. In a histogram of torque data, for example, the X axis shows the range of torque values, while the Y axis shows how frequently each value came up. This histogram will follow a normal distribution. That is, the values are distributed along a bell-shaped curve that is symmetrical about the mean torque value.
Every reading in the set will differ slightly from the mean. The standard deviation is the amount by which each reading is most likely to differ from the average. Usually denoted by the Greek letter, s, the standard deviation indicates how well a process is performing. If torque accuracy is critical, engineers will want a curve that is tall and narrow.
To find the standard deviation, subtract the mean from the torque value of each fastening operation. Square each result, add them all together, and then divide this sum by the number of fastening operations. This is the variance. Take the square root of the variance to get the standard deviation.
In the histogram, the area under the curve that lies within one standard deviation of the mean represents 68 percent of all torque readings in the data set. The area within two deviations represents 95 percent of all readings, and the area within three deviations represents 99.7 percent of all readings.
Why is this important? If 99.7 percent of torque values fall within three standard deviations of the mean due to normal variation, such as friction, then engineers know a problem—something outside the norm—is occurring if the tool starts reporting torque values outside that range. Perhaps the tool is broken, or the operator is installing the wrong screw.
Looking for quick answers on assembly and manufacturing topics? Try Ask ASM, our new smart AI search tool. Ask ASM
The same analysis can determine if a new tool is accurate enough to meet your specification. Let’s say a bolt should be tightened to 20 newton-meters ±10 percent. For the tool to meet that specification, it would have to tighten the bolt such that three standard deviations would be within ±10 percent of 20 newton-meters. After multiple run-downs on a sample joint, the tool produces an average torque of 20 newton-meters and a standard deviation of 0.5 newton-meter. Now do the math: [(3 x 0.5) ÷ 20] x 100 = 7.5 percent. The tool will work.
This analysis can be done even if the tool will be used on both hard and soft joints. In this case, the mean for the hard joint will be higher than that for the soft. Plotted separately, the histograms will overlap. To determine if the tool is accurate enough, you must calculate whether the combined torque scatter falls within your tolerance range. At one end will be the mean for either the hard joint or the soft joint plus three standard deviations, whichever is higher. At the other end will be the mean for either the hard joint or the soft joint minus three standard deviations, whichever is lower. To determine the accuracy, subtract the high end from the low end, multiply by 50, and divide the result by the average torque value for both joints combined.
X-Bar and R Charts
The goal of analyzing torque and angle data is to identify variation in the fastening process before faulty joints can be assembled. One way to do that is with statistical control charts called X-bar and R charts. If your fastening process is under control, all torque and angle values should be within plus or minus three standard deviations of the target value, or six-sigma limits. If a problem occurs—a tool breaks or a batch of substandard fasteners reaches the line—it can affect the average value, the spread of the values, or both. X-bar and R charts identify such problems quickly by comparing samples of data to your overall results.
To plot an X-bar chart, collect a sample of consecutive torque or angle readings at regular intervals. This can be once an hour, once a shift, once a day, or whatever makes sense for your operation or assembly. The sample size needn’t be very large. Four to six readings is sufficient. Bear in mind that the shorter your sampling interval, the faster you can identify potential problems.
Next, calculate the mean (X-bar) for each sample and plot them over time. When the assembly process is under control, the sample averages will spread randomly around the overall mean (µ). In addition, the sample averages should fall within the upper control limit (µ + 3s√n, where n is the number of overall readings) and the lower control limit (µ - 3s√n). The overall mean and control limits are indicated by horizontal lines running across the chart. For best results, these values should be based on a large number of fastening operations, and they should be recalculated at regular intervals.
The X-bar chart shows how much variation exists in your fastening operation from hour to hour, shift to shift, or whatever sample period you’ve chosen. Because the spread between individual measurements is bigger than the spread between sample averages, you have a better chance of detecting deviations from the overall mean by analyzing the samples rather than the entire data set. If the sample average trends upward or downward, or if it’s consistently above or below the overall mean, something abnormal is happening. Production can continue, but the process should be looked at. If the sample average falls outside the control limits, assembly should stop and engineers should investigate the problem immediately to prevent substandard joints from being made.
The R chart, or range chart, performs a similar function. It shows how much variation there is within each sample. Ideally, this variation should be small and consistent over time. As with the X-bar chart, trends and outlying points indicate that something out of the ordinary is happening on the line.
Instead of plotting the average of each sample, you plot the range—the difference between the biggest and smallest value in each sample over time. (A cousin of the R chart, the S chart, plots the standard deviation of each sample.)
Like the X-bar chart, the R chart has horizontal lines running across it, representing the target value and upper control limit. If the sample size is six or less, there is no lower control limit. In this case, the target value is the average of the range values of all the samples. The upper control limit is the average range times a statistical constant: 2.282 for a sample size of four, 2.114 for a sample size of five, and 2.004 for a sample size of six.
Understanding and Using Cpk
One way to evaluate the capability and performance of a fastening operation is via the process capability index (Cpk). This statistic measures how close a process is to a specified performance target (final torque, for example) and how consistent the process is to your average performance.
Cpk measures two things. First, it measures how close the mean of the readings is to the center of the lower and upper specification limits. (Ideally, the mean of the readings should equal the center of the specification limits). Second, it measures how widely spread the readings are. (Ideally, the standard deviation of the readings should be zero). The higher the Cpk, the more capable the fastening process is of meeting your requirements.
A Cpk of less than 1.66 needs a closer look. A Cpk less than 1.33 needs some action to make it higher, and a Cpk of less than 1 means that the process is not capable of meeting your requirements.
A low Cpk means one of three things: the mean is far from the center of the specified limits; the standard deviation of the readings is high (in other words, the readings are widely spread); or both.
The Cpk measures how centered the output of the process is between its lower and upper specification limits and how variable (and therefore how stable or unstable) the output is. The Cpk is expressed as the ratio of how far the mean of the output data is from your set specification limits to three times their standard deviation (the process variability).
If the mean of the process data is closer to the lower specification limit (LSL), then Cpk = (Mean - LSL) / 3s. If the mean of the process data is closer to the upper specification limit (USL), then Cpk = (USL - Mean) / 3s.
Most capability evaluations are valid only if the sample size is large enough. How many data points are enough? Some 50 independent data values are generally sufficient.
—Source: Mountz Inc. (www.mountztorque.com)
Looking for a reprint of this article?
From high-res PDFs to custom plaques, order your copy today!