OEE and Wire Processing

Digitization, Industry 4.0 and the Industrial Internet of Things (IIOT) are buzzwords we hear quite often today. What do they mean for the wire processing industry? How will digitization affect our business, and how will we measure our performance?
Industry 4.0 means complete connectivity throughout the manufacturing enterprise, from corporate levels down to the machine level and throughout the complete supply chain. As a result, manufacturing will change significantly in the future. We’ll be able to gather real-time data on our production as well as vendor deliveries and customer requirements.
This connectedness will give us access to much more data about our production and supply chain processes. But, what do we do with all that data? How do we use it to improve our processes? This article will focus on one key metric: overall equipment effectiveness (OEE).
The purpose of OEE analysis is to improve performance and efficiencies. In the end, the result will be lower manufacturing costs, higher output and higher profits.
Brief History
The term OEE was coined by Seiichi Nakajima, one of the pioneers of the total productive maintenance system. OEE is a measure of how well a manufacturing operation is used, compared to its full potential. In other words, OEE is the percentage of manufacturing time that is truly productive. An OEE of 100 percent means that only good parts are produced (100 percent quality), at the maximum speed (100 percent performance), and without interruption (100 percent availability).
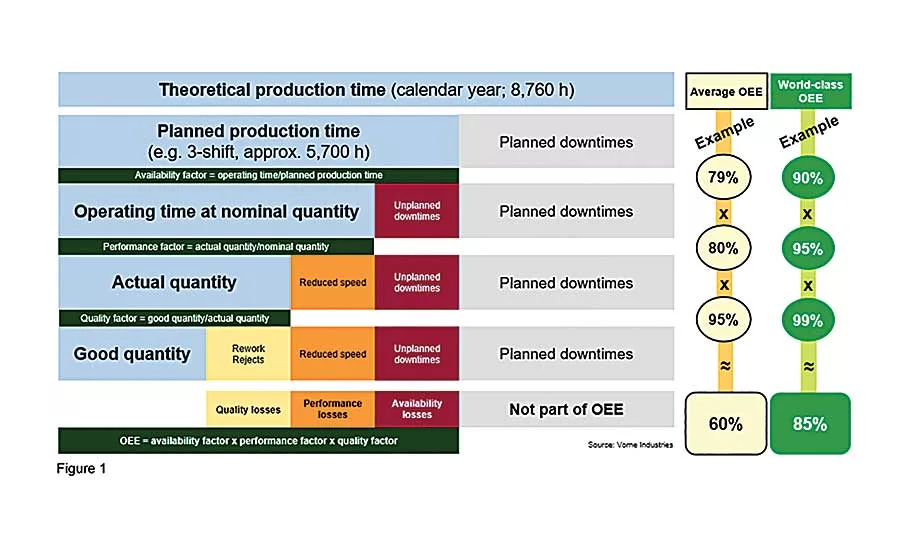
OEE is calculated as the product of three components:
- Availability, the percentage of scheduled time that the operation is available to operate.
- Performance, the speed at which a machine or assembly line runs as a percentage of its designed speed.
- Quality, the number of good units produced as a percentage of the total units started. It is commonly referred to as the first pass yield.
An average OEE is 60 percent, whereas a world-class OEE is 85 percent.
To calculate OEE, start with your theoretical production time—for instance, 8,760 hours, which is the total number of hours in a calendar year.
Looking for quick answers on assembly and manufacturing topics? Try Ask ASM, our new smart AI search tool. Ask ASM
Next, calculate your planned production time. For instance, planned production time in a three-shift operation would be approximately 5,700 hours of production per year. The rest is planned downtime. Planned downtime is never considered as part of the OEE calculations. You only consider what is expected or what should be possible to produce.
Availability is actual operating time divided by planned production time, expressed as a percentage. However, the actual operating time should be considered when operation is running at expected performance. In any case, the difference between the planned and actual production time is unplanned downtime. An average availability factor is about 79 percent. This means that the machines are in operation 79 percent of the planned production time. A world-class availability factor is 90 percent.
Performance is the actual quantity you produced divided by the quantity expected, expressed as a percentage. There are many reasons why your equipment might not produce as much as you expected. For example, the machines might have run slower because of worn parts or suboptimal materials. An average performance factor is about 80 percent, whereas a world-class factor is 95 percent.
Quality is the total number of good parts divided by the total number of parts produced (good parts as well as rejects), expressed as a percentage. An average quality factor is about 95 percent, whereas a world-class factor is 99 percent.
Prerequisites
To effectively implement an OEE monitoring system, certain things must be understood pertaining to the machines, data collection and data usage.
First, OEE is intended for plants and machinery. It is not intended for manual workstations, because manual labor tends to be less consistent, and there are too many variables to consider.
In addition, there must be measurable output in proportion to a unit of time, such as units per day or liters per hour. It is not enough just to measure the number of units. You must measure the number of units within a certain period.
Results must be reproducible with certain parameters. In other words, a machine should produce a consistent number of pieces per hour when feed speed, swivel speed and wait times are duplicated. If there is no correlation between parameters and outputs, there is no way to make adjustments to a machine or process and anticipate outcomes.
OEE is not intended for single-piece production. Rather, it is intended for comparison and improvement. Such low-volume production does not allow this. Higher production volumes are required.
Similarly, planned utilization should be sufficiently large. For instance, if a machine or a process is only activated 2 or 3 hours every other week, OEE will not be effective.
OEE requires accurate and ample data. It must be possible to capture data with either a data acquisition system embedded in the machine or an external system that analyzes production data.
Of course, the data must be accurate and realistic. The data collection and calculations must be identical between locations so that all may arrive at respective conclusions and provide recommendations.
Many harness assemblers have manual data collection systems, and they do their best to estimate utilization. However, we have seen that these estimates are just that—estimates—and those estimates are typically wrong. Therefore, automated systems need to be implemented to really understand utilization.
The data must be available to all stakeholders, including personnel from production, engineering, quality and management. All the terms and data must be accurately defined and understood by all.
When comparing multiple sites, especially when in different locations, it is imperative that the definitions of key terms, goals and procedures are thoroughly understood by everyone. If not, the data collected could be very different and inaccurate.
Remember, the goal of measuring OEE is to improve performance and efficiency of the plant. Data must be compared regularly and consistently to previous results to determine the effect of any changes.
It will not be helpful to measure OEE, implement some change, and then not re-evaluate for the next year. OEE should be measured multiple times per year, if not monthly, especially after changes have been implemented. It is necessary to perform analysis and provide conclusions or recommendations for future improvements.
Six Major Losses
There are six major types of losses that can affect your OEE percentage, two for each productivity factor.
Availability is most affected by disruptions and idle time. Disruptions could be machine faults, while idle time might be due to unavailable materials or resources.
Performance is most affected by downtime and reduced speed. Downtime is when the machine is not working due to damage. Reduced speed is when the operator might need to run the machine slower. This might be because the machine is damaged or perhaps bad material cannot run as fast as good material.
Quality is most affected by rework and rejects. These are similar, but rework represents parts that are not completely irreparable. Although automatic machines may detect a reject, typically the machine will compensate and produce a new, good part. Therefore, the total batch from the machine will be good quality. However, rejects produced on the machine will also affect the performance factor and would fall under the “reduced speed” category.
It’s worth noting that a positive change in one area may have a negative effect on another. For instance, operators might increase machine processing speeds to improve performance. However, this might have a negative effect on quality. Therefore, monitoring must be done at regular intervals to find the best solutions.
Technology Requirements
Certain technologies will be required to effectively and accurately collect the data required to calculate OEE.
Sensors will be required to collect production and quality data from the machinery. For instance, to detect idle time vs. setup time may require multiple sensors to detect certain conditions that are indicative of each scenario. However, the sensors must be integrated with the equipment so that they do not interfere with the function or the overall process. Typically, older machines require more external sensors, whereas newer machines have these capabilities built into their software.
Cloud technology is required to efficiently process and store data from multiple machines and multiple plants. Although many companies are rightfully concerned about safety with cloud technology, it truly is the most cost-effective method of data collection, storage and distribution.
Mobile terminals will be required at workcells for the input and output of real-time information. Some machines are too simple for sensor or software integration. Operators will need to provide key inputs and receive key instructions for the job.
Software—and even artificial intelligence—will be needed to analyze data. Don’t think so? Consider this: Let’s say a harness assembler has 40 machines that process 3,000 to 4,500 pieces per hour. A variety of data is collected from the shop floor, including material validation, crimp height measurements, pull test results, and length measurements.
Each batch results in 80 to 100 transactions per batch. This results in some 58,000 transactions per day or approximately 14,400,000 transactions per year just for production.
Fortunately, however, these are typically just text bits, so all that data only represents 1 or 2 gigabytes per year. However, this does not consider audits, machine failures or logs, nor does it consider operator log-in and log-out, scrap, and other data points. So, depending on your plant size and requirements, the amount of data could be large.
Diagnosis and Resolution
Now that we are collecting data and can find problems, how do we resolve them? Diagnosing and solving problems is a straightforward process.
First, data confirms that a problem is present or performance is lower than expected. Perhaps setup times have become too long.
Next, conclusions are drawn about the root cause of the problem. After some analysis, you might find that because some technicians have left, there is now only one setup technician for every 20 machines.
Once you know what’s causing the problem, you can take steps to immediately correct the situation. These steps might not be the most effective solution, but the situation is at least under control. In our hypothetical case, for example, you could immediately hire two more technicians.
Next comes prevention. With the situation under control, you can think about a better, long-term solution. For example, after further analysis, you might find that the order in which the jobs are sent to the machine requires more changeovers. If the jobs were better organized, the number of changeovers could be minimized, thereby minimizing setup time.
Now you can take steps to eliminate the problem and implement a long-term solution. In our case, you could implement software to automatically sort the orders so changeovers are minimized.
Often, upper management may need to get involved to fully resolve issues. For instance, issues with vendor quality will typically require management to work with the vendor to resolve the issue. Therefore, employees at every level of a company are required to fully implement an OEE analysis program.
Industry 4.0 and digitization is coming, and there will be tremendous benefits to manufacturing in all areas. Implementing an OEE analysis program will give you a vastly improved understanding of your machines and processes and how they are all interrelated. What’s more, an OEE program will make it easier to identify issues and implement long-term resolutions.
Looking for a reprint of this article?
From high-res PDFs to custom plaques, order your copy today!


