Connecting People and Processes to Drive Productivity
Rockwell Automation Inc. will build a new greenfield manufacturing site in southeastern Wisconsin.
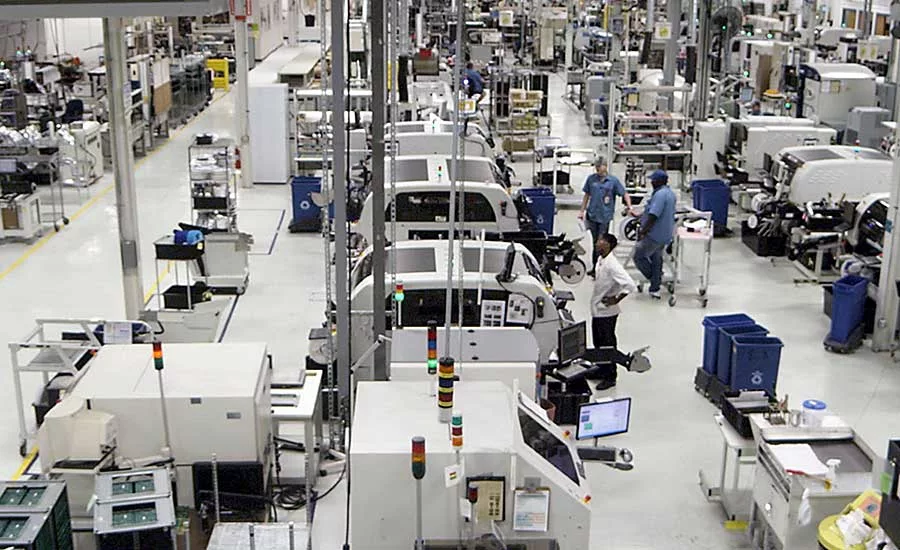
At Rockwell’s assembly plant in Twinsburg, OH, lines were going down due to part shortages on a weekly basis. IoT technology solved the problem. Photo courtesy Rockwell Automation
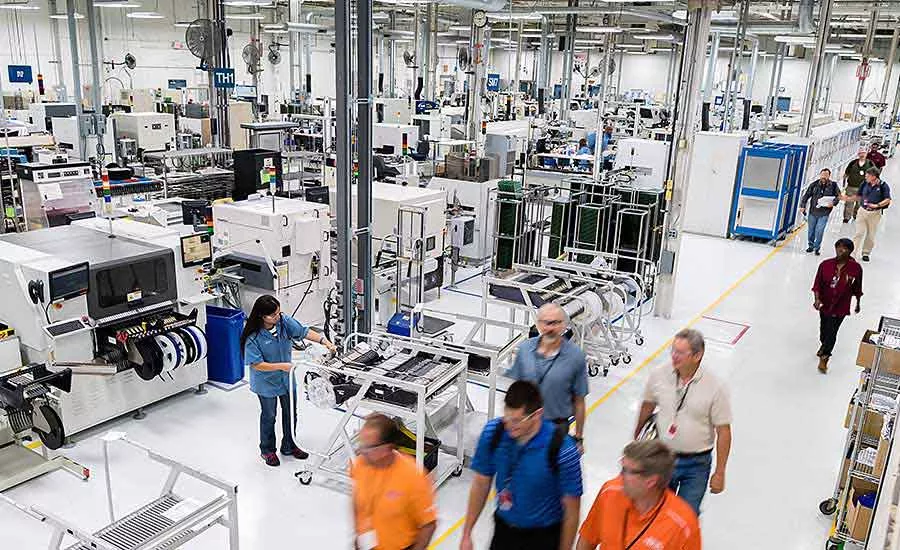
Few manufacturers today are lacking for data; the challenge lies in contextualizing the data into a story that can ring true for the whole operation. Photo courtesy Rockwell Automation
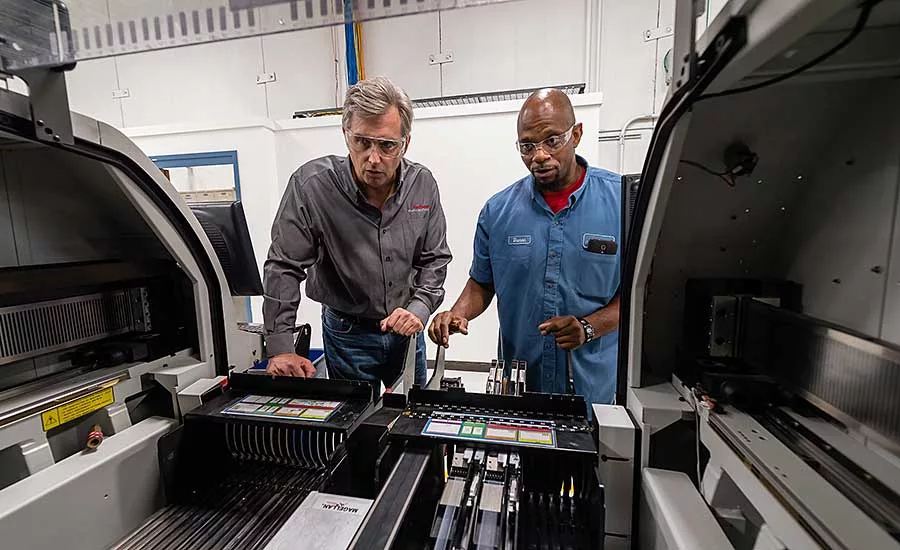
If a line is going to run out of materials, workers can double up or triple up to get kits done and prevent downtime. Photo courtesy Rockwell Automation
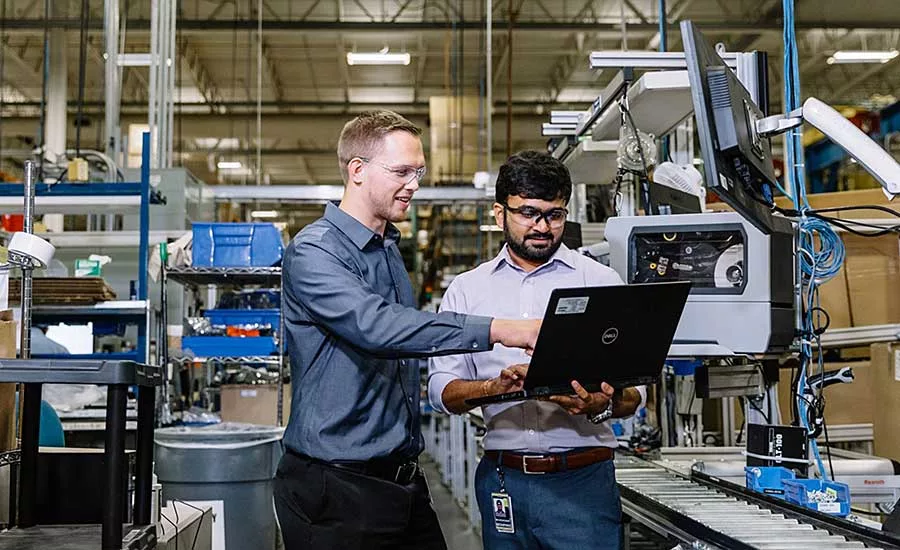
Through color-coding and visibility into production status across all lines, operators can now quickly see where they need to prioritize work. Photo courtesy Rockwell Automation
Companies achieve manufacturing excellence when people have the tools they need to produce high-quality work. On the shop floor, this comes about through the marriage of workers and machinery and the refining of processes through constant care and iteration. The source of this excellence lies in the quality of information manufacturers can draw out of their operations and share with their workforce to continuously improve performance and worker productivity.
Plants operate by the numbers. Monitors and whiteboards display key performance indicators and statistics by hour and shift. Information is drawn from a variety of sources to provide a common source of truth that helps teams focus on performance, output and potential issues. To operate as a true, connected workcell, workers rely on data to inform their workflows and maintain productivity. Few manufacturers today are lacking for data; the challenge lies in contextualizing the data into a story that can ring true for the whole operation. That journey to the truth starts by getting visibility into what’s really happening on the front lines.
Making Music Out Of A Data Mash-Up
Recently, Rockwell Automation needed to solve problem at four plants where it had made significant investments in highly automated lines for producing millions of parts each day. We wanted the lines to run 24/7 to keep up with demand and make the most of our investment, but the lines were running out due to parts shortages. At our plant in Twinsburg, OH, lines were going down on a weekly basis.
For the process to work properly, the production and material teams needed to synchronize their efforts, but each operated under different performance goals. The materials team delivered work in the form of kits to production. Each kit contained one or more work orders. Kits then traveled to another line, to build the work order and return the kit to the kitting area. This orchestration required a minimal level of materials to keep each line running at any given time. But the teams had no visibility into work queues to understand how to prioritize each line—and wound up kitting excess material for some lines or not kitting enough for others.
The scope of the issue for Rockwell Automation was compounded across other plants producing similar products—two plants in the US, two more in Mexico and Singapore—each with different processes but all facing the same problem. In aggregate, these 23 lines represented an estimated three billion data points per plant, per year.
To maintain productivity, we knew that we would have to collect and visualize the data to better balance and prioritize workflows. The data was there, just buried across multiple systems. If we were going to keep the lines running and maintain throughput, we would need to mash up the data into a visual format to sync performance across materials and production and prevent costly, unscheduled downtime.
State-Of-The-Art Visualization
With 50 occurrences of downtime in one year alone, we focused on the Twinsburg plant to address the issue through a pilot project. Reducing the number and frequency of line-down occurrences was our top goal. Production leaders tracking status were spending as much as two to three hours per shift. Communication of when priorities change between the two teams was critical. Finally, we wanted better visibility into how much time it would take to complete each kit, so we could feed this data into our workflows and maximize productivity.
Looking for quick answers on assembly and manufacturing topics? Try Ask ASM, our new smart AI search tool. Ask ASM
Rockwell Automation partnered with PTC for its expertise in Internet of Things (IoT) technology, combining data from disparate sources and visualizing it in easy-to-use views. PTC leveraged its ThingWorx software platform to create data mash-ups that provide a view into production status across seven lines and help operators visualize two key data points:
The outcome is a digitally automated display showing the amount of work in production for each of the seven lines.
- how much time remains on a line before it runs out of material
- which line to work on next.
To produce this display, the team used Rockwell’s FactoryTalk manufacturing execution system. They leveraged a connector built by Rockwell Automation and PTC that integrated the ThingWorx platform to mash up data from multiple systems and functions. This combined data sets from line machine configuration, takt time, production scheduling and setup, as well as data from the material kitting process. They built the logic behind the values by inputting the time required to produce each step, the bill of materials needed for specific products, and the required time to prepare each item for the feeder.
The team applied a simple numbering scheme to assign prioritization value: a line displaying a “5” indicated five hours required to complete the kit. A “3” would be a higher priority, with only three hours remaining to complete the work. Color-coding helped differentiate between the lines, so managers could correlate tasks at a glance. Through the PTC IoT technology and a successful pilot, Rockwell Automation was on its way to finding a common source of truth and giving workers the dashboards they needed to maintain productivity and keep the lines running around the clock.
Moving From Whiteboards To Digital Displays
Through color-coding and visibility into production status across all lines, operators can now quickly see where they need to prioritize work. If a line drops below five hours, a flashing red light appears on the dashboard alerting workers to drop what they’re doing and move to the line that’s about to run out of material and shut down. Because the dashboard auto-refreshed every 15 minutes, data stayed in sync across all information sources.
Operators now have a clear view of how long it takes to complete each kit. They know that if a line is going to run out in five hours, but only required three hours to build the order, they can easily prioritize work. Conversely, if they know a line is going to run out of materials, they can double up or triple up to get the kit done and prevent downtime. They now have visibility into production status—and a common goal between the two teams—and are avoiding bottlenecks, preventing issues, maintaining quality and productivity.
With a successful pilot in Twinsburg, we reduced our weekly annual downtimes from 50 to zero. The ability to better prioritize production drove down labor costs, arming us with a solution we could share across other plants. We can now keep our lines running 24/7 by connecting information to the people who need it, all through a simple display.
For more information on automation hardware and software, visit Rockwell Automation’s website. For more information on IoT technology, visit PTC’s website.
Looking for a reprint of this article?
From high-res PDFs to custom plaques, order your copy today!


