Automation University
Defining Throughput in Automated Assembly Systems

OEE combines multiple elements into one measurement of a line’s capability. Those elements are availability, performance and quality. Photo courtesy Production Control Units
You are an engineer, not a lawyer, so you probably don’t like to think about contracts and contractual obligations. But, even the most elegant designs are not very useful if they don’t satisfy a business objective, and business objectives are measured in revenue (output), costs (capital and operating), profits and risks.
While you may not be involved in negotiations on penalty clauses, bank guarantees, warranty coverage and other minutiae, the one thing that equipment design directly impacts is throughput, which will be one of the main buy-off criteria. So, on that front, at least, you do need to pay close attention to the contract.
Unfortunately, a lot of the terminology in specifications and quotations is imprecise, misused or even conflicting, so it’s important to understand exactly what is expected and how your design can meet those expectations. This article will help you navigate through some of the terminology.
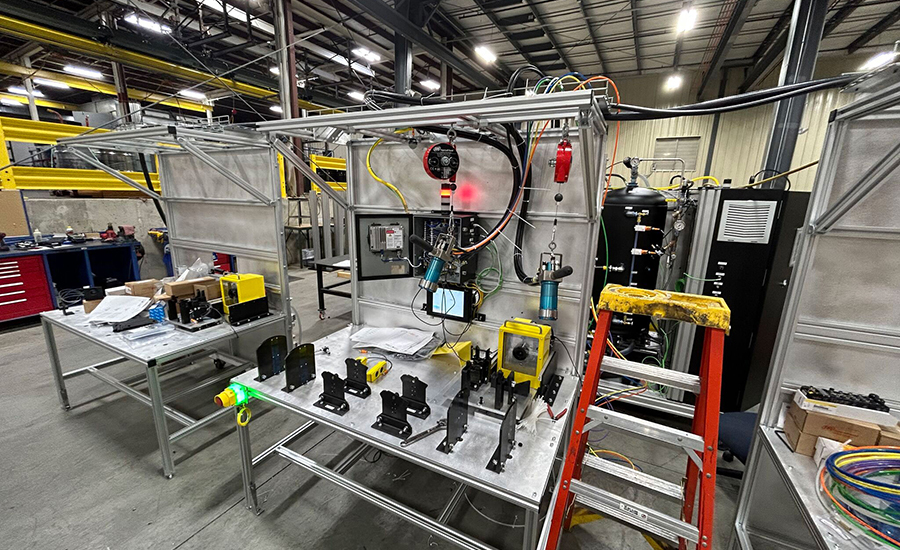
Two small indexing dials with a buffer conveyor between them are often better than one 30-station system connected with a precision-link conveyor. Photo courtesy Promatic Automation Inc.
Takt Time vs. Cycle Time
Takt time is often used interchangeably with cycle time, but that is a bit of a misnomer. Takt time is the pace at which a line must produce a part to satisfy customer demand, so it varies with that demand. Cycle time is the maximum rate that a line can produce parts, irrespective of demand. One is a limit to the other. If the cycle time of the equipment is 10 seconds, you cannot have a takt time that is faster than 10 seconds. Since specifications for equipment are generally written to satisfy a given production volume, the mixing of the terms isn’t that big of a deal. However, some customers will ask for systems that allow for varying output or varying model mixes, so understanding the real definition can be beneficial.
Except for casual, nontechnical conversations, “cycle time” should not be used to define throughput of a line and should be avoided in any meaningful discussions. It is open to interpretation and will likely create confusion.
Equipment, or automation, cycle time is a holdover from the “olden days,” but worth mentioning. There was a time when manufacturers maintained large staffs of industrial engineers whose job was to define a “reasonable” cycle time for a manual operation. They took responsibility for that part of the cycle, while the machine builder was accountable for the automation portion of the machine. This was contractually the cleanest measure of throughput for an assembly system, since we have no control over the training, skill and motivation of the operators.
Over time, however, responsibility for the output of the entire system was pushed to the machine builder, so you likely won’t see “equipment cycle time” as a standalone acceptance criteria. Keep it in the back of your mind. In a dispute, proving that the equipment is capable on its own can be important.
Looking for quick answers on assembly and manufacturing topics? Try Ask ASM, our new smart AI search tool. Ask ASM
Design cycle time, or gross cycle time, is the target short-term cycle time, excluding any downtime or inefficiencies. It’s not widely used, but it still has some value because it clearly distinguishes the goal vs. measured results.
It’s an easy concept to grasp, but hard to measure because inefficiencies and downtime do exist. It’s best if the measurement method for this term is established upfront in the quotation. At the very least, it should be nailed down prior to runoff. I recommend picking a relatively small number of cycles—10 or 20—so you can ensure a trouble-free test. Take the overall time to produce those parts and then divide that by the number of parts to get the average gross cycle time. Sometimes, demonstrating this number to the customer isn’t even a runoff requirement, but it’s absolutely essential data to have in case you have to dig deeper into a throughput issue. Never complete debug without documenting it.
Net cycle time is simply gross cycle time multiplied by efficiency, so it is the output of the line over time during scheduled production. It was once a common criterion for passing a runoff test, but it has since been superseded by overall equipment effectiveness (OEE).
This station is designed to pump refrigerant into air-conditioner assemblies. Photo courtesy Production Control Units
Yield and Efficiency
First-pass yield is a quality measure that is derived by dividing the total number of good parts made by the total number of parts. As you would expect, acceptable values for this are typically greater than 99 percent.
One cautionary note about using first-pass yield as an acceptance criterion for your equipment: You must analyze the root causes of any reject parts. Especially with assembly equipment, the failure mode is often not driven by the equipment, but rather by the underlying part geometry.
Let’s say, for example, that a reject in a press-fit application was caused because the force specification was not met. Was it because the hole was 0.002 inch oversize? Or was it because the ram was moving too fast? Similarly, in a screwdriving application, a part might be rejected because a torque specification was not met. Was it because of tight threads or an incorrectly setup torque profile in the equipment?
It can be tedious to identify the cause of every reject. However, since only one or two rejected parts are enough to disqualify a runoff, anything beyond the control of the equipment should be mathematically excluded when calculating first-pass yield. Those exclusions should also be taken into account when calculating the throughput of the machine. They should be subtracted from the theoretical number of parts the machine can produce.
Efficiency is defined as the actual output of a line vs. its theoretical maximum output. It’s calculated by dividing the number of parts produced (good or bad) over time by the total number of parts that should have been made in that period, excluding any scheduled downtime, such as breaks or maintenance. That number is then multiplied by 100 to get a percentage.
Note that the time window should be fairly long relative to the target cycle time. One shift is a typical time frame.
Sometimes, the definition is modified to only include good parts made, so there is some ambiguity in the term.
An acceptable number for efficiency is 80 to 95 percent, depending on product complexity and other factors.
A related statistic, OEE, has become the Holy Grail for automotive manufacturers, and it is catching on in other industries, too. It combines multiple elements into one measurement of a line’s ability to produce parts. Those elements are availability, performance and quality.
Availability is the amount of time that the equipment is available for production during planned production time. So, if an 8-hour shift includes a 30-minute lunch, two 10-minute breaks, and 15 minutes of cleanup and maintenance, planned production time is 415 minutes per shift. If your equipment was down for 20 minutes because a switch failed, that means availability for that shift was (415-20)/415 x 100, or 95.2 percent.
Performance is the same as efficiency. It takes into account things such as small stoppages, slow cycles, or noncyclical restocking that prevents production. So, if the design cycle time of the line is 10 seconds, and the average cycle time while the machine was available was 11 seconds, performance would be 10/11 x 100, or 91 percent.
Since cycle times can be difficult to measure, engineers sometimes use “parts in the box” instead. If the line was available for the 395 minutes in the shift (415 - 20), and the design cycle time was 10 seconds, theoretically, you should have produced 2,370 parts. Let’s say you created three rejects, so those would be excluded, so the denominator is 2,367. If you actually produced 2,151 good parts, your performance is 2,151/2,367 x 100 or 90.9 percent.
Performance is almost always capped at 100 percent, so you can’t intentionally design the line to be faster than the theoretical need just to pass runoff, although there are places where you may want to do just that. We’ll discuss that later.
Quality incorporates first-pass yield. To continue our example, we made 2,151 good parts and three rejects in our shift. Quality would then be 2,151/(2,151 + 3) x 100, or 99.9 percent.
OEE is availability x performance x quality. In our example, it would be 0.952 x 0.909 x 0.999 x 100 or 86.5 percent.
First-pass yield is a quality measure that is derived by dividing the total number of good parts made by the total number of parts. Photo courtesy Honeywell International Inc.
In the Mean Time
Although they don’t apply to throughput, two other terms are worth discussing: mean time between failure (MTBF) and mean time to repair (MTTR). MTBF is the average amount of time a machine can be expected to run between downtime events. MTTR is the average amount of time to fix a machine when it does go down.
These can be valuable tools for analyzing production equipment, but they are almost impossible to calculate upfront. If you make a standard product, you may get real-world data for MTBF and MTTR. But, if you build custom equipment, it’s a crap shoot.
In theory, you could list all the system components, determine how long each will last, and aggregate that data into a model that attempts to predict that interaction between those parts. However, there are two problems with that scenario.
First, data from component manufacturers varies wildly. I remember looking up the MTBF for a low-cost pneumatic cylinder and a large profile-rail bearing. The published MTBF for the cylinder was twice that of the bearing, even though anyone in our industry would say that is abjectly backwards and maybe even off in the wrong direction by a factor of 10.
Second, MTBF data from component manufacturers are derived from laboratory testing under ideal conditions. If, for example, the load on that profile bearing is off-center, the MTBF will be much lower.
When you consider that an automated assembly system consists of hundreds or even thousands of components, estimating MTBF for an entire line is virtually impossible. Estimating MTTR is more guesswork.
Just remember that “availability” term in the OEE calculation. You can’t pass a runoff if there’s any unplanned downtime. Even if the machine does pass runoff, nothing destroys a customer relationship faster than a nagging production problem. Always invest in high-quality components. If you do end up with a marginally performing process, don’t just put a Band-Aid on it. It will come back to bite you.
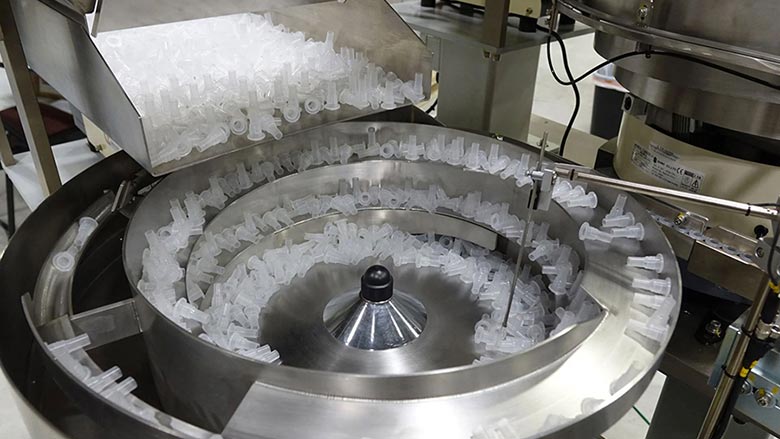
Feeder bowls are notorious for reducing OEE. Bent parts jam. Some parts tangle. The tuning changes over time. Photo courtesy Bellco Feeders
Applying the Definitions to Your Designs
Why do all these terms matter? They can impact how you look at your machine design, so it’s best to understand what has been specified, what has been quoted, and how the machine will be accepted before you choose components and head down the design path. Here are a few things to think about.
First, there is no right number for OEE, but there are plenty of wrong ones. In the past, 85 percent was a widely accepted target for OEE. Today, it’s often 90 percent or even 95 percent. That’s not necessarily a problem for machine builders. What is problematic is that the OEE target is embedded into every specification without any discussion about whether it’s achievable or how much it will cost.
Let’s look at the math for a line. The number of stations directly affects the ability to hit the overall goal. The OEE for an entire system is calculated by the following formula: OEEs = (OEEi)n, where OEEs is the OEE of the system; OEEi is the OEE of each station, and n is the number of stations. This equation assumes the OEE target for each system is the same.
To achieve an OEEs of 90 percent on a five-station line, each station must achieve an OEEi of 97.9 percent. For a 10-station line, each station must hit an OEEi of 98.95 percent. That difference may seem small, but it is significant. At the same time, machine builders will also receive specifications that each station on the line must meet that same 90 percent OEE target.
This is impossible. The math doesn’t work. To complete a four-hour run at 90 percent OEEs on a five-station line, each station can generate about 5 minutes of lost production [4 x 60 x (1-0.979)]. With a 10-station line, each station can only generate 2.5 minutes of lost production. But, if each station only needs to meet an OEEi of 90 percent, it can be down for 24 minutes and still meet the goal. That’s the danger of a one-size-fits-all answer without agreement on what the numbers mean.
The type of equipment also has a significant effect. A lean cell with limited automation and a lot of manual operations will have a higher OEE because people can work faster for short periods to make up for things that go wrong.
In contrast, an automated assembly systems keeps the same cadence, and losses remain losses. If one station goes down on a rotary indexing system, the entire machine is down with no ability to make up for lost production. Asynchronous systems are a little more forgiving. They can make up for small downtime events with no overall loss if the downtime occurs at faster stations. Buffers can be strategically placed at certain stations to keep the system running.
Feeder bowls are notorious for reducing OEE. Bent parts jam. Some parts tangle. The tuning changes over time.
Complexity is typically nonlinear. An eight-motion station is not twice as complex as a four-motion station. It’s more like three times more complex, due to the interactions between the motions and packing them into limited space.
All of this must be kept in mind when you design a system to meet a given OEE.
This automated workstation is part of a system to evacuate, fill and test braking systems. Photo courtesy Production Control Units
How to Maximize OEE
Do an OEE risk analysis on each process. What could cause stoppages or downtime? Parts feeding, close-tolerance fits, parts with cast or molded features that must be used for nesting and location—many things can cause downtime.
More than 50 percent of all production stoppages are because the equipment is not forgiving enough to handle variation in the parts. Engineers tend to be “nominal” thinking people. But production is messy, and equipment performance degrades over time, so try to accommodate part variation outside of specified tolerances as long as it doesn’t impact cost. Certainly, your machine isn’t responsible for turning bad parts into good ones. But, think about what you can do—within budget—to make the machine care a little less about what it’s being fed.
Gravity may be a constant, but it doesn’t work consistently. Friction almost always beats gravity over time. Gravity-feed conveyors will cause downtime eventually unless they are well thought out. Make sure you consider the center of gravity of the part, the geometry of the surface it’s riding on, and the geometry of the conveyor surface. How does the conveyor work fully loaded? How does it work empty? Try starting the parts moving from a dead stop and stopping them at full speed. I’ve spent a lot of time debugging gravity conveyors. They can be effective, but they can also be a nightmare.
Automated assembly systems never have perfectly balanced station cycle times. If you can group tasks so the highest risk operations also happen to be on the faster stations, it will benefit lean cells and nonsynchronous conveyor lines. (It won’t matter on synchronous lines.)
Make sure you buffer appropriately on lean cells and nonsynchronous systems. Buffer size on nonsynchronous systems varies by cycle time and the distances that pallets must travel, but rarely should you have less than one pallet waiting at a station. Most of the time, it should be two. It could even be as high as five or six on high-speed systems. Extra pallets will be needed for longer runs, corners, elevators and other obstacles. Too many pallets can actually hurt your throughput, but the right amount can make up for small downtime situations on faster stations.
Yes, buffers are considered a waste in lean manufacturing. However, even the most ardent lean advocates would agree that small strategic buffers are a good idea to smooth the small production variations any line will see.
Make sure you plan out the recovery steps for high-frequency, quickly corrected stoppages, such as clearing feeder jams or exchanging dunnage. If it can be made safe, locate those processes outside of guards and near operators. If it must be inside a guarded area, make sure the downtime associated with correcting an issue and restarting is as fast as possible. No manufacturer will want an operator to be clearing feeder jams every five minutes. But, if the operator can fix five to 10 stuck parts a shift without losing production time, that won’t count against OEE.
Make sure operators know when there’s a problem almost immediately. Lights, buzzers or HMI notifications are key to gaining time back.
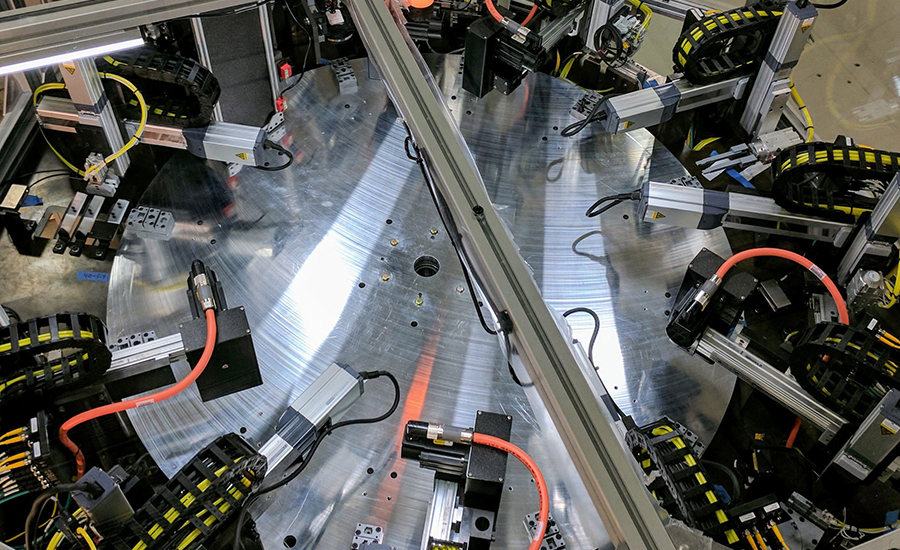
Keep stations on synchronous systems fairly simple. Any downtime stops everything, so complexity is the enemy to throughput. Unless the stations are simple operations, such as picking and placing parts, consider breaking up the system. Two or three smaller dials with buffer conveyors between them are often better than one 30-station system connected with a precision-link conveyor.
Downtime for repairs counts in OEE calculations. That won’t be an issue during runoff, but it will play into the long-term number. There is no better salesperson on earth than an automated line that outperforms all others on the customer’s plant floor. So, any wear items or maintenance points should be easily accessible, and if possible, require no tools to fix. Every second counts. Remember, almost all car races are won in the pits, not on the track. You should think that way, too.
Remember that exchanging or removing dunnage is included in OEE calculations. So, figure out who has to do it. Will it be a person that’s always around, but not immediately there? Will it be an operator, or a forklift operator who is tending the entire plant? Make sure you think these things through and design your station layout to accommodate it.
Engineers are typically better at estimating times for automated tasks than for manual ones. Photo courtesy Production Control Units
The Wildcard: People
Whenever people are involved, things get messy. People are the ultimate in autonomous, intelligent, collaborative “automation,” but they also have bad days and varying levels of motivation and quality consciousness.
There is often a big learning curve with manually intensive stations. I remember working on an assembly line as a young man. I felt like I was all thumbs trying to keep up with the line rate. Meanwhile, a more experienced co-worker was doing the same job—as she was reading a novel!
As engineers, we tend to be better at estimating times for automated tasks than for manual ones. That’s important, because during runoff, you will need to make rate with people who have never seen the line and may or may not be motivated to have a successful runoff. Often, if a machine builder’s own staff can run the line at rate, it will go a long way towards achieving customer approval. So, practice running the line as if it were in production during debug.
Final Thoughts
Trying to determine the long-term performance of a line during a few hours of runoff is a daunting task. That task is made more difficult by the fact that it’s contractually binding, and both sides want to make sure that they are not the reason for a failed acceptance run, or worse yet, a poorly running line. I have often wondered how much excess capacity, cost and contract negotiation energy is buried in each piece of capital equipment just to make sure that one event happens successfully. There must be a better, more stepped approach in which both the machine builder and customer share a little more risk and work together more closely to achieve their goals over the production launch period.
But, that is hard to do in a fixed bid, competitive situation, so we all do the best we can to protect our companies and maintain a good relationship. While I don’t have any magic bullet answers, two things are absolutely critical: Keep all this in front of you during the design, build and debug of the equipment. And, make sure there is a clear acceptance plan in place long before the customer shows up for the runoff. None of it happens by accident!
For more information on automation, call Production Control Units at 937-299-5594 or visit www.pcuinc.com. For more wisdom on automation, read Bill Budde’s blog at www.automationdesignhacks.com
Looking for a reprint of this article?
From high-res PDFs to custom plaques, order your copy today!


