Uncovering Hidden Capacity Using OEE
By monitoring OEE, assemblers can reduce process variability, changeover times, overtime expenditures and capital investments.
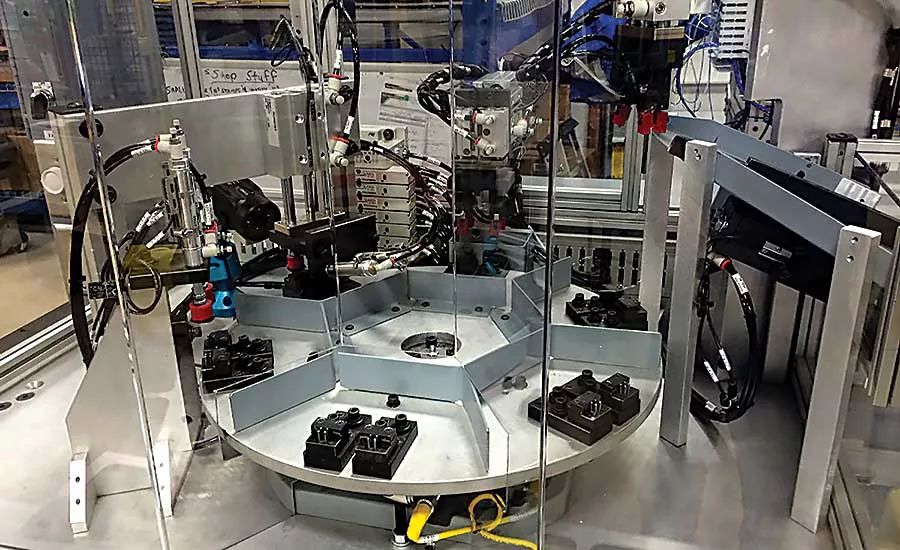
One reason OEE is such a valuable measure is that it allows manufacturers to look at all sources of lost time and lost production. Photo courtesy Blue Water Controls LLC
Many companies routinely hit capacity constraints and immediately consider adding overtime for existing workers, hiring workers for a new shift, or buying a new line. Relatively few companies have made the more modest investment that is required to optimize the performance of their existing lines.
As the global marketplace changes, it has become increasingly clear that stakeholders put a large value on an organization’s ability to maximize productivity and utilization. With consumers demanding lower and lower prices, a reduction in operating costs and cost of goods sold has never been more needed to stay competitive.
One way to measure a plant’s performance and productivity is with overall equipment effectiveness (OEE). This article will talk about OEE and how to fully use this key performance indicator to your benefit.
Many manufacturing companies have been measuring the efficiency of their lines and workcells in such a way as to mask many of the causes of lost efficiency. Over a period of years, management focuses on the numbers being reported and is no longer thinking about what is included or excluded from the measurement.
One reason OEE is such a valuable measure is that it allows manufacturers to look at all sources of lost time and lost production. OEE can deliver accurate and actionable intelligence to decision makers for significant productivity improvement.
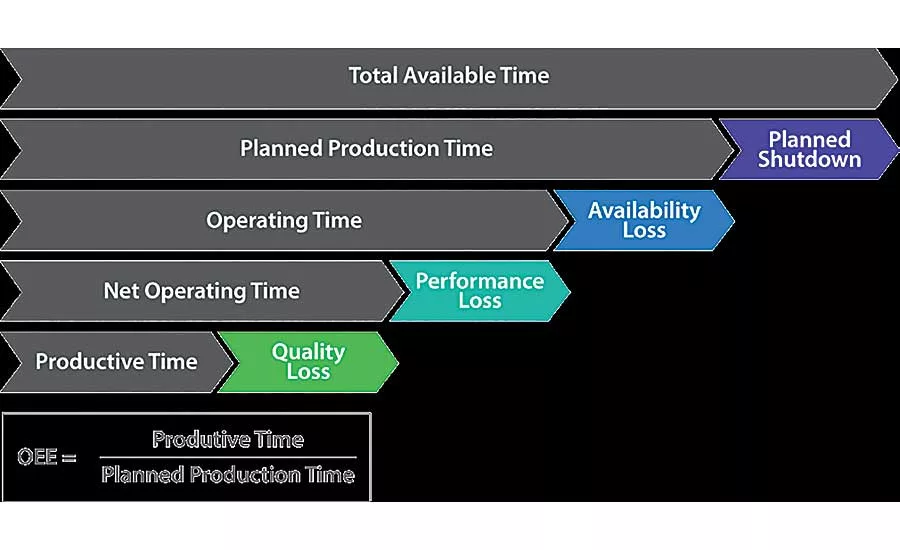
Before we delve into OEE and how to best calculate it, let’s briefly discuss the various time categories involved in the equation.
The first is “total available time.” This is the time that the plant is open and theoretically could be producing goods.
Looking for quick answers on assembly and manufacturing topics? Try Ask ASM, our new smart AI search tool. Ask ASM
The second is “planned production time.” This is total available time minus planned shutdown time. Planned shutdown time could include meal breaks, holiday shutdown and scheduled maintenance.
The third is “operating time.” This is the difference between planned production time and the time lost to downtime. Downtime events include equipment breakdowns, unscheduled maintenance, setup time and changeover. This is included in calculating OEE.
The fourth is “net operating time.” This is the difference between operating time and time lost to a reduction in speed. Speed reduction events include operating equipment at below rated speed (increased cycle time), frequent short-lived stoppages not requiring maintenance, and certain operator errors. This is also included when calculating OEE.
Lastly, there’s “productive time.” This is the difference between net operating time and the time lost to quality issues. Quality loss includes rejected and reworked products. This, too, is included when calculating OEE.
How Is OEE Calculated?
By definition, OEE is the product of availability, performance, and quality percentages:
OEE = Availability * Performance * Quality.
Availability is a measure of downtime losses. Performance is a measure of speed losses. Quality is a measure of defect losses.
Each one of these OEE components represents losses that result in a reduction of operating time. We begin with total available time and subtract time losses due to availability (downtime), performance (speed), and quality (rejects and rework). Very quickly, one can see the effects of these losses on production time.
By definition then, productive time is a fraction of total available time. By measuring and understanding the losses, we can take the actions necessary to increase productive time as much as possible.
Now, let’s talk about the most common losses related to the various OEE categories.
Availability is typically reduced by planned and unplanned events, such as changeovers, sanitation and cleaning, preventive maintenance, meetings, training, startup and shutdown, parts shortages, facility problems (power outages, for example), and capital projects.
Performance is typically reduced by:
- Running a production system at a speed lower than the theoretical run rate for that assembly on that line or machine.
- Brief stops, such as jams, overloads, gaps in components on the line, or other faults that can be cleared without maintenance intervention. Many lines have 1,000 or more short stops per week, which result in a massive reduction of output.
Planned shutdown time, or time when production is not needed, is normally excluded from OEE calculations.
Quality is typically reduced by any product that is rejected or must be reworked.
Real-World Example
Now, let’s take a look at how OEE is calculated with a real-world example.
Here are the variables:
Total time: The process is scheduled to work five days a week, 24 hours each day, for a total of 7,200 minutes.
Downtime: The machine stopped for whatever reason 1,440 minutes.
Cycle time: 1.5 minutes per unit.
Good units: In five days, 2,880 pieces.
Defective units: In five days, 240 defective pieces.
Now we can calculate availability, performance and quality:
A = (Total Time – Downtime) / Total Time.
A = (7,200 minutes – 1,440 minutes) / 7,200 minutes = 80 percent.
P = [(Good Units + Defect Units) * Cycle Time] / (Total Time – Downtime).
P = [(2,880 pieces + 240 pieces) * 1.5 minutes / piece] / (7,200 minutes – 1,440 minutes) = 81.5 percent.
Q = Good Units / (Good Units + Defect Units).
Q = 2,880 pieces / (2,880 pieces + 240 pieces) = 92.3 percent.
Going back to our main equation, OEE = A * P * Q, we get:
OEE = 80 percent * 81.5 percent * 92.3 percent = 60 percent.
However, there are several shortcuts to calculating OEE. The simplest and easiest is this:
OEE = (Good Units * Cycle Time) / Total Time.
In our example, then:
[2,880 pieces * (1.5 minutes / piece)] / 7,200 minutes = 60 percent.
Let’s look at a slightly more complex real-world example at a canned food plant. Here are the numbers:
- Average line efficiency is 88 percent using the traditional way of measuring efficiency, in which availability and short stops failures are not counted.
- OEE calculation time period is three days, or 4,320 minutes.
- Time not scheduled is 1,230 minutes. The plant operates two shifts per day. Over three days, the line should be unused for 24 hours (1,440 minutes). But, looking at the time cards, with overtime, the actual time not scheduled is 20.5 hours (1,230 minutes).
- Planned production time is 3,090 minutes (4,320 minutes - 1,230 minutes).
- The theoretical production rate of the product is 500 cans per minute.
- First pass yield is 1,027,500 cans. This number comes from the production report; it is not calculated.
- Calculated OEE is 66.5 percent.
- Looking at our example, you can see how a few small changes can have a significant impact. For example:
- By reducing setup times (making a small investment in tooling, establishing best practices, and training workers), availability improves from 80 percent to 85 percent.
- By identifying and resolving the five most serious causes of short stops, performance improves from 84 percent to 86 percent.
- By identifying the No. 1 cause of rejects and resolving it, quality improves from 99 percent to 99.2 percent.
Compound these small improvement numbers and OEE jumps from 66.5 percent to 72.5 percent. This six-point improvement of OEE is a 9 percent improvement in the overall value. This means that the canned food plant can now produce 9 percent more product with the same assets in the same time, or if demand is fixed, produce the same quantity with a 9 percent reduction in operating costs.
In sum, our canned food plant can produce an additional 43,200 cans daily with the same assets and costs ($32,400 per day), resulting in a yearly addition of $11.3 million in revenue. In addition, the plant can work 95 fewer shifts per year (when running 24/7, 350 days per year).
For more information on manufacturing software, call Parsec Automation at 714-996-5302 or visit www.parsec-corp.com.
Looking for a reprint of this article?
From high-res PDFs to custom plaques, order your copy today!


