NDT | Aerospace
Advances in Automated NDT: Viable Inspection Solutions for Aerospace Applications
Advanced ultrasonic testing solutions must keep pace with these new challenges while maintaining the rigorous quality control standards that ensure aircraft safety.

Image Source: aapsky / iStock / Getty Images Plus
Aerospace components vary in shape, size, and material composition, each requiring tailored inspection methods to ensure quality and safety. These critical parts are manufactured using diverse processes such as forging, casting, composite layups, and material bonding, each introducing unique challenges that demand specialized verification techniques. Despite these variations, all aerospace components must undergo rigorous inspections to meet stringent industry standards.
Automated Ultrasonic Testing (UT) systems play a key role in improving efficiency, reducing inspection time, and enhancing imaging and defect detection capabilities. However, to fully harness the potential of automated ultrasonic testing solutions, advanced tools are essential at multiple levels: scanner control, inspection planning, and UT results analysis.
THE NEED FOR ADVANCED TOOLS IN AUTOMATED UT INSPECTION
By integrating advanced tools at every stage of the UT inspection process (scanner control, inspection planning, and results interpretation), automated NDT systems can deliver the precision, efficiency, and reliability required for modern aerospace manufacturing.
Scanner Control Tools
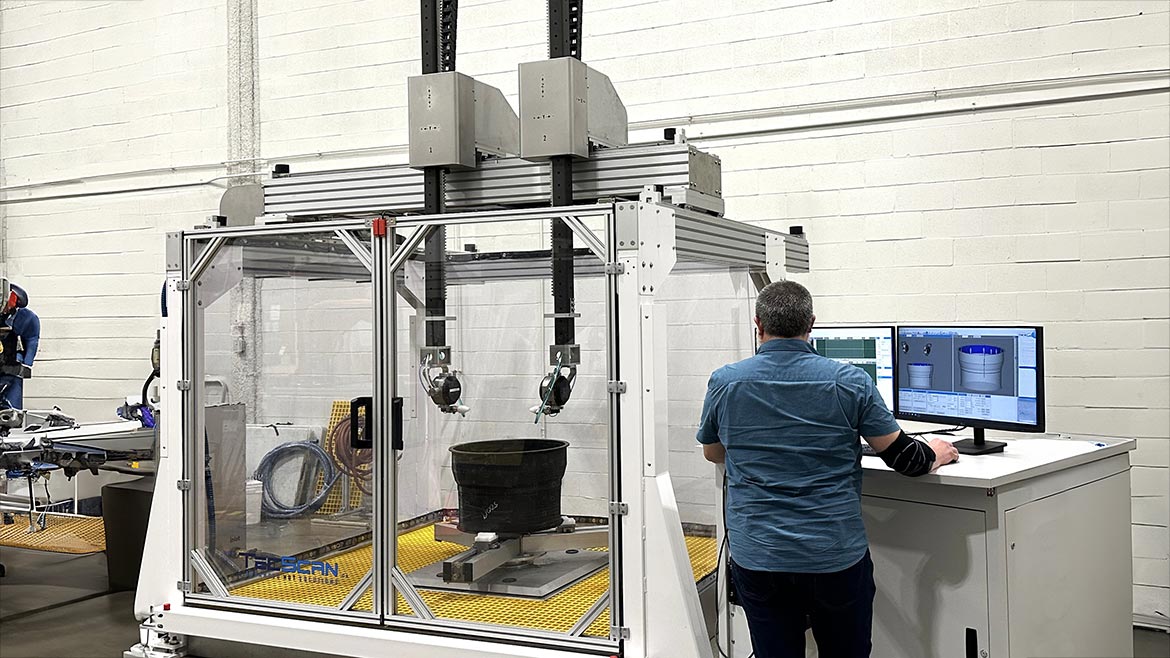
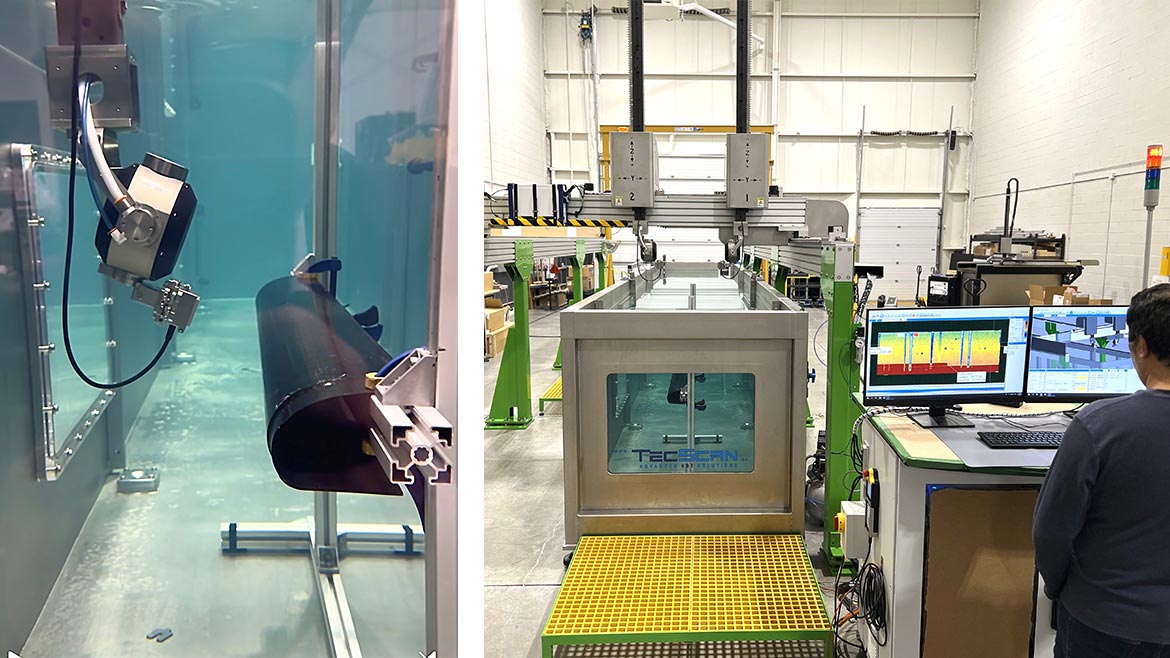
Ultrasonic testing of aerospace components with complex 3D geometries requires advanced control tools to achieve precise and comprehensive scanner control. For example, UT immersion tanks and squirter gantry systems integrate contour-following capabilities and multi-axis motion control to ensure accurate UT inspection coverage. These systems can also be equipped with 3D Scanning capabilities using advanced path-planning algorithms to adapt to intricate surface profiles, enabling full volumetric inspection. Additional scanner control capabilities and tools are also required to monitor and maintain the ultrasonic probes alignment to achieve proper scanning resolutions.
Inspection Planning Tools
In the scanner control software environment, inspectors need intuitive inspection and planning tools to allow them to define the UT scan paths easily and with precision. This can be done by creating a realistic and accurate virtual CAD representation of both the part and the scanner within the software control environment. Operators can also use such tool to calibrate the scanner and simulate the whole UT inspection process.
This virtual 3D display environment can also be used to assist with the preparation of scanning paths, more specifically to modify scanning path to avoid areas where mechanical limitations are reached and collisions become inevitable, as well as in the definition of safe probe approach trajectories. These inspection tools not only streamline the scan preparation process but can also enhance repeatability and reliability in UT testing.
NDT Analysis Tools
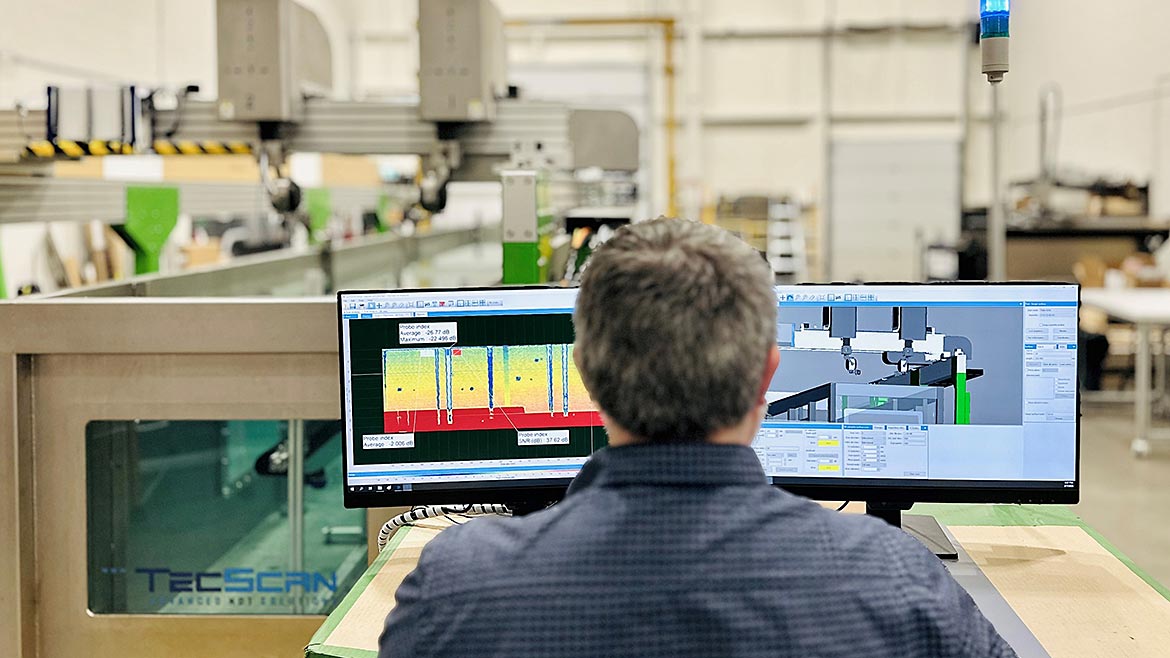
Finally, the accuracy of any nondestructive testing (NDT) solution relies on robust results interpretation tools. Advanced data processing software must be capable of analyzing vast amounts of inspection data, filtering out noise, and highlighting potential defects with high precision. Intelligent algorithms, 3D visualization, and user-driven analysis further improve defect detection, ensuring reliable results that meet aerospace quality standards.
Looking for quick answers on assembly and manufacturing topics? Try Ask ASM, our new smart AI search tool. Ask ASM
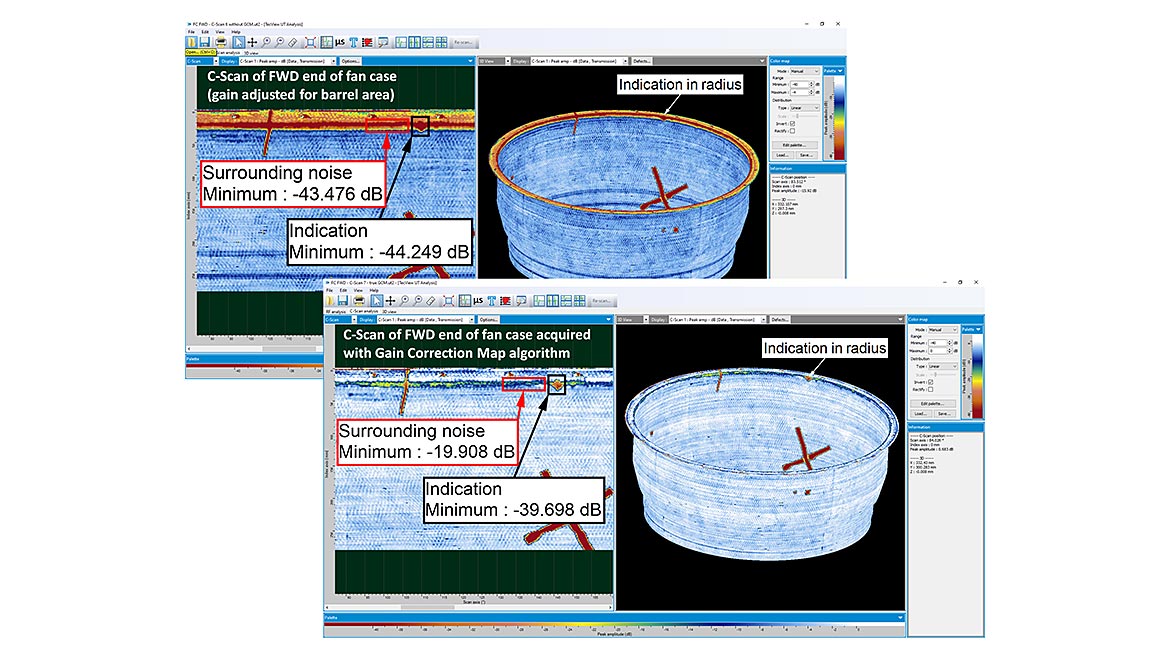
A key example of such analysis tools is the gain correction map algorithm, which allows us to account for natural signal attenuation in complex geometries by dynamically adjusting the receiver gain as the probe(s) move across the surface of the inspected part or component. This is based on a pre-calibration of the attenuation occurring naturally on the part.
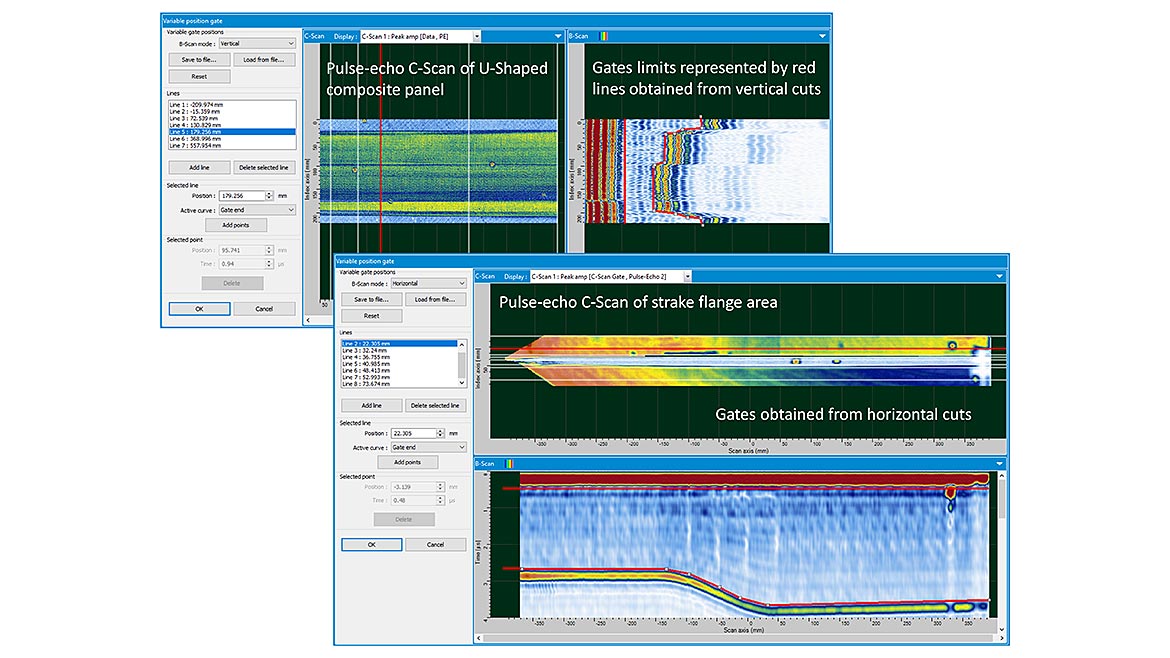
Variable signal gating is another essential tool, particularly when variations in component thickness prevents from using simple gates to detect indications without interferences from the back wall echo. With position-dependent gating, the detection gate dynamically adjusts based on the B-Scan representation, following the component thickness.
Other advanced tools and analysis capabilities include automatic detection of indications from the C-Scan data, creating lists of indications after separation and merging of pixels based on user-defined criteria, various signal-to-noise analysis types (statistical or local), and advanced reporting tools.
SELECTED APPLICATIONS FOR AUTOMATED TESTING OF AIRCRAFT COMPONENTS
Composite materials are now widely used for a variety of aircrafts parts, from honeycomb sandwiched structures found in wing flaps to 3D woven composite materials such as the LEAP engine fan blades. Most composite materials can be considered as 3D panels, meaning they have curved surfaces with mostly parallel planes. Both pulse-echo and transmission scans are used on such parts depending on the type of defects to be detected. While porosity is typically characterized by attenuation of the backwall echo in a pulse-echo setup, bonding quality is often assessed by transmitting ultrasounds through the part’s thickness. In honeycomb structures, transmission is the only viable option since backwall echoes rarely propagate back through the core.
The following sections highlight key applications of automated testing systems equipped with advanced NDT scanning tools.
U-Shaped Carbon Composite Part
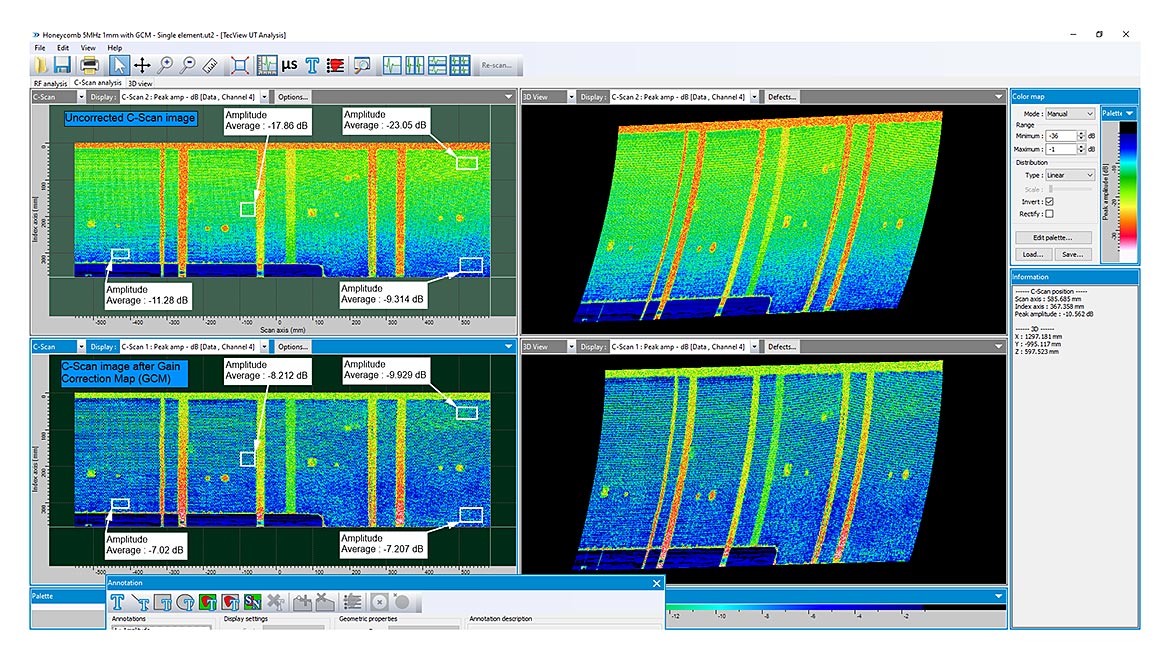
This example highlights advanced motion control and data interpretation functionalities necessary to fulfill inspection requirements. The U-shaped carbon composite part features areas of different thicknesses. Despite its simple appearance, 3D contour following scanning is required to maintain a constant beam entry angle and water path. Variable gating is also necessary to avoid setting up a specific gate for each thickness variation.
Since porosity is often monitored in carbon composite laminates, backwall echoes attenuation must be analyzed. This can be done by evaluating the acceptable dB drop for each thickness range or calculating the attenuation per units of thickness.
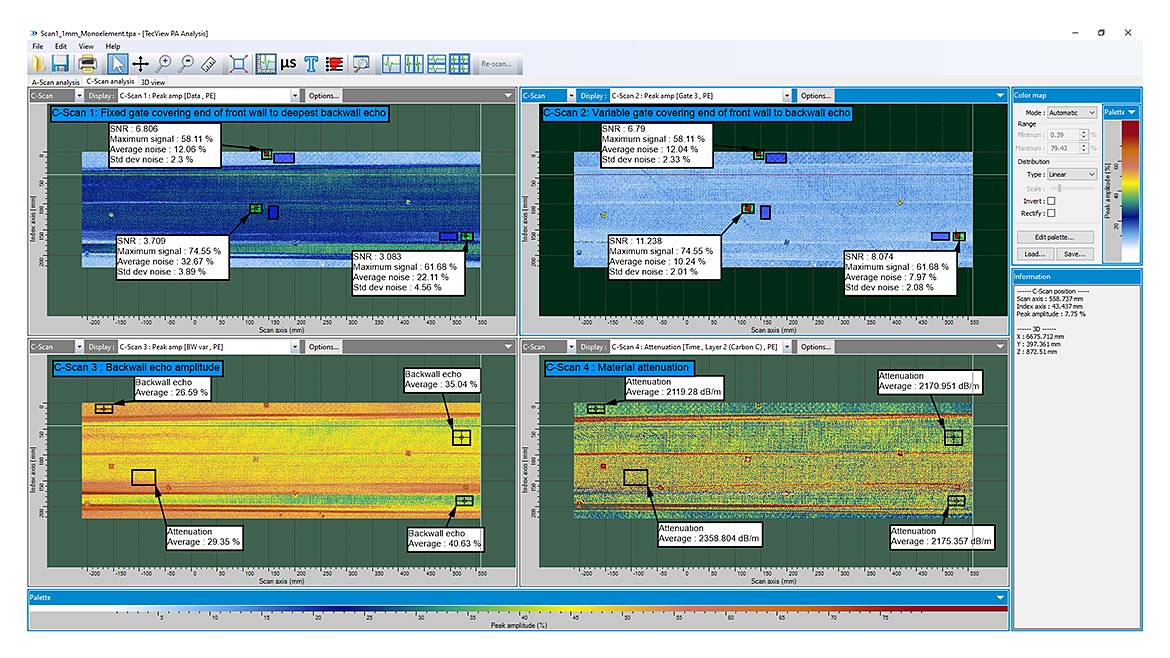
In the above example of Fig. 6, the benefits of variable gating (C-Scan 2, top-right) for the detection of internal indications is illustrated by comparison to a fixed gate (C-Scan 1, top-left). Porosity characterization can also benefit from a conversion of backwall amplitude (C-Scan 3, bottom-left) to attenuation data (C-Scan 4, bottom-right). While direct backwall amplitude must be compared to the expected signal amplitude or drop corresponding to the thickness of a specific area, attenuation provides a reading that is independent from thickness. This is beautifully illustrated in this example, where large variations observed on the backwall amplitude are not relevant when converted to attenuation, especially for the lowest monitored backwall amplitude which converts to the lowest attenuation.
To enhance data reporting efficiency, C-Scan images can be projected onto the actual 3D shape of the inspected part, improving both the positioning and visualization of detected indications.
Aircraft Wing Flaps
Aircraft wing flaps represent another example of 3D composite panels requiring advanced tools to obtain optimal scan results. The sample presented below is an aluminum honeycomb core bonded to curved aluminum skins, scanned in a through-transmission setup using a pair of phased array probes.
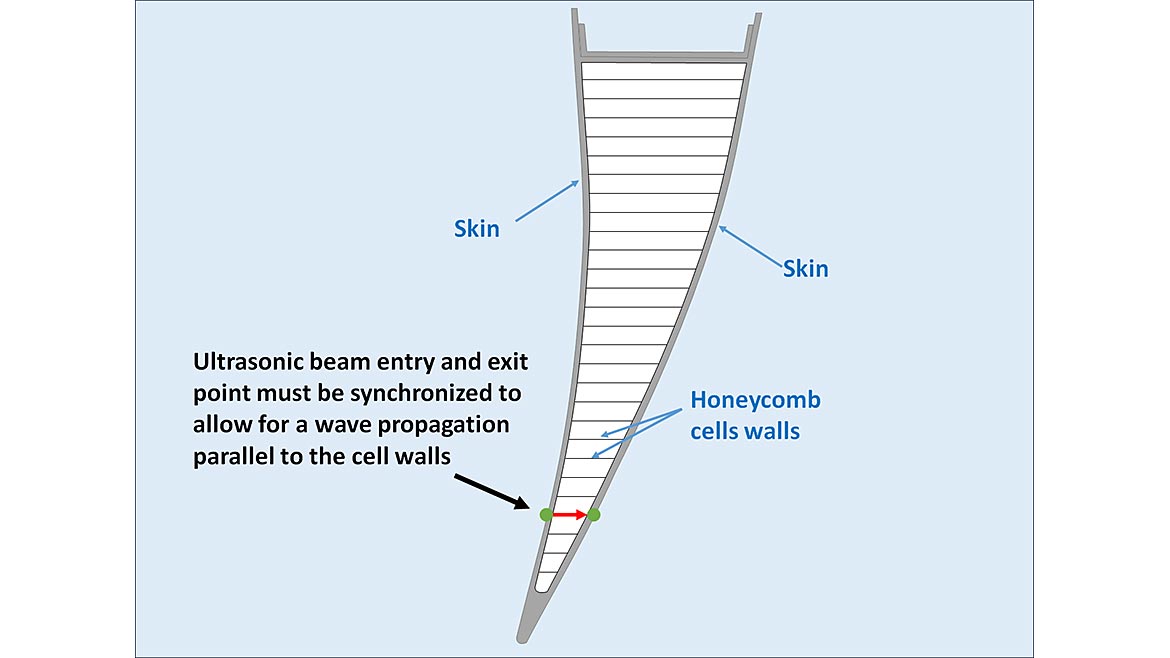
Due to its curved shape, 3D contour following is necessary. However, the presence of the honeycomb structure complicates the scanning trajectories calculation. As an example, the general cross-sectional shape of a wing flap is presented in Fig. 8; as illustrated by the parallel lines, the honeycomb cell walls run through the thickness independently from the angle of the skin surface. In addition, the thickness of the honeycomb structure varies along the part profile, leading to variations of ultrasonic attenuation.
Ultrasonic waves can only propagate through the walls of the honeycomb cells, which means that the emitting and receiving probes locates on both sides of the sample must align with the cell’s walls to get proper transmission through the thickness. Consequently, the motion control software must allow to associate entry and exit points that are aligned with the core cells in the calculation of scanning trajectories. Phased array scanning is also beneficial to minimize scanning time on such large structures. This requires state-of-the art algorithms to manage data acquisition of phased array on curved surfaces that preserves the true dimensions of the part.
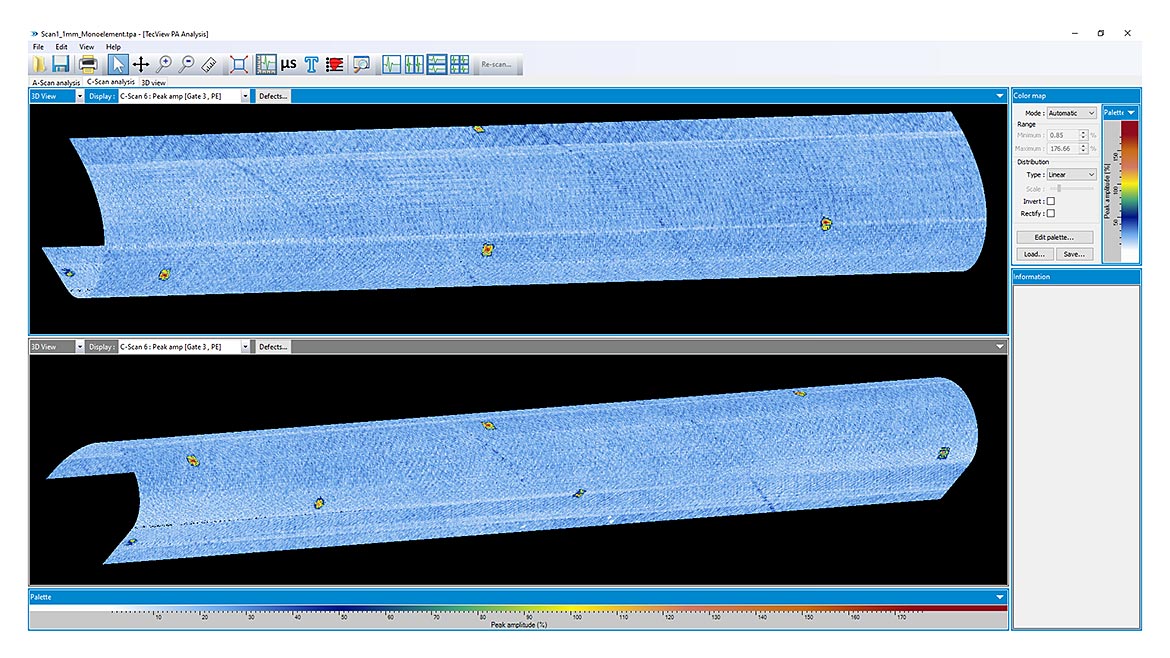
Since the thickness of the honeycomb structure is not the same everywhere and the direction of propagation of ultrasounds inside the part is not necessarily achieved with optimal entry and exit angle at the skin surface, significant differences in wave attenuation can occur across the part. A gain correction map function that dynamically corrects the gain as a function of local attenuation represents a highly valuable tool for such structure. By correcting the gain as a function of scanning position, a strong signal can be maintained across the part, leading to the same amplitude accuracy and an optimal signal-to-noise ratio at any position. Benefits of this technique are illustrated in the C-Scan images of Fig. 9, which were acquired on a wing flap sample, both without and with the gain correction map.
Aircraft Engine Nacelle Chines and Strakes
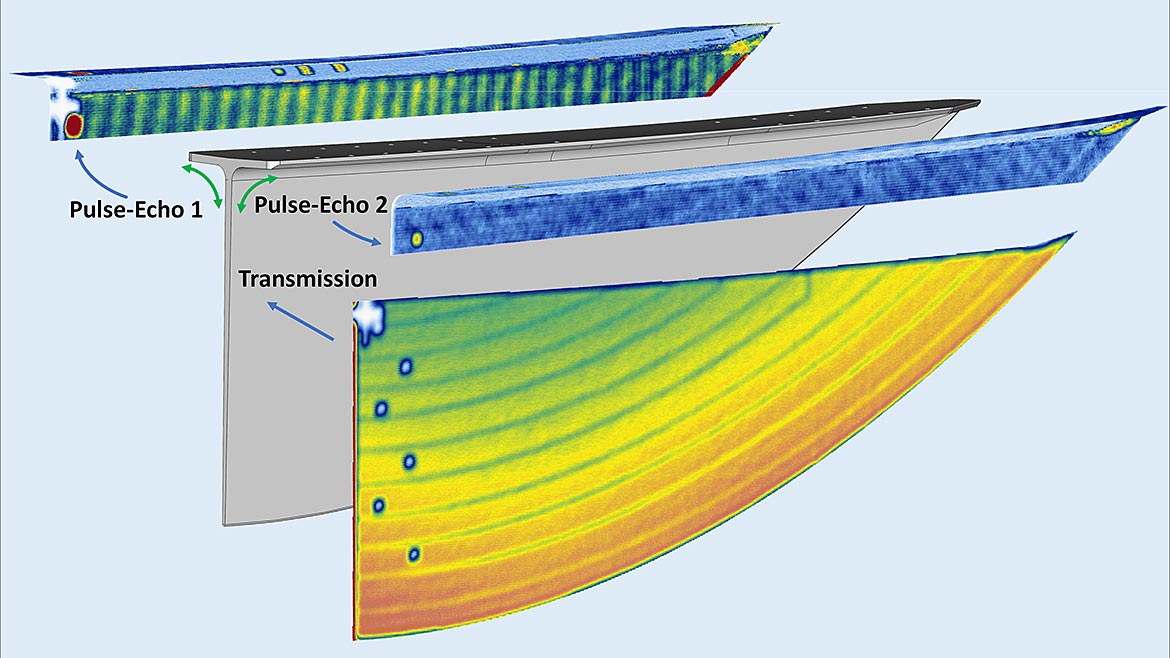
Aircraft engine chines and strakes represent a slightly more complex form of composite panels. With their T-shape, multiple setups are required to scan the entire part. In the example below, the fin of a strake was scanned in a through-transmission setup, while both sides of the flange are scanned in pulse-echo. These scans were done using a 10-axis scanner with two independent sets of X-Y-Z-A-B axes.
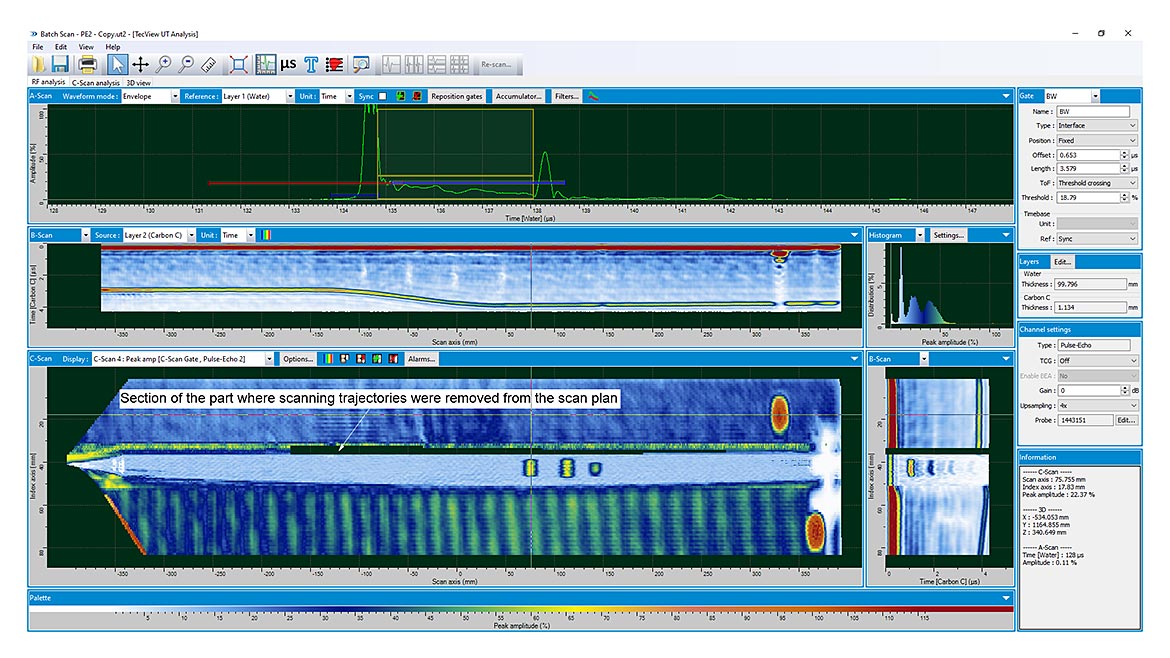
One of the tools that can minimize scan time is a batch scan utility, i.e. the ability to execute multiple scan setups automatically without requiring any operator intervention. Pulse-echo and through-transmission scans were therefore performed in a programmed sequence, as illustrated in Fig. 10. In addition, these structures have varying thickness that require variable gating for pulse-echo scan data interpretation.
Another particularity of the strakes and chines is the tight radius of the transition between the fin and the flange. Scanning surfaces at and around the flange radius therefore presents high risks of interference between the probe gimbal manipulator and the part.
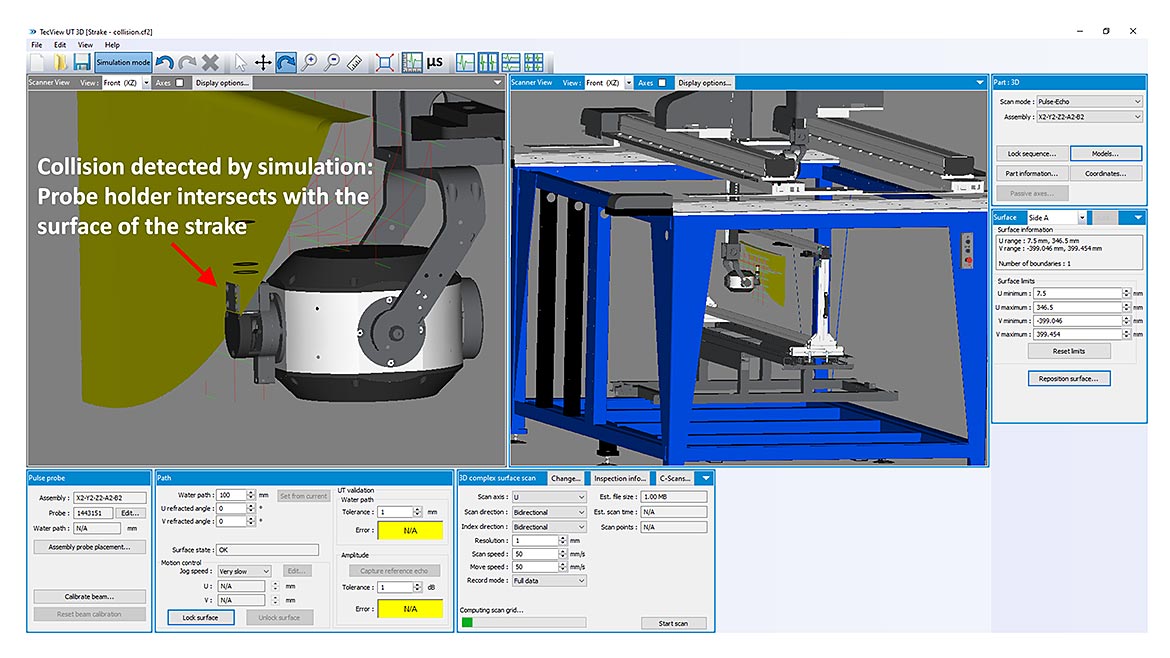
This is where accurate simulation tools become essential in the preparation of the scan setup. Collisions can be identified by simulating the movement of the probe around the radius at the required water column and angle and trajectories can be modified to avoid such interferences. This exercise leads to an optimization of the scanning time by maximizing areas of the part that can be scanned automatically, while identifying areas where a complementary manual inspection may be necessary. In the example below, a section of surface identified by simulation and leading to collisions has been removed from the scanning area, thus avoiding the problematic trajectories.
Conclusions
Multiple advanced ultrasonic scanning tools were highlighted through examples of scan data acquired on various aircraft components. While 3D contour-following scanning tools were featured in all presented cases, additional valuables functions, such as the scanner’s virtual 3D environment display and offline simulation, were demonstrated for engine carbon composite strakes and chines. These part, with small flange radii, pose a high risk of mechanical interferences with the automated probe holder gimbal head. By simulating the scanning environment, potential collisions were identified, allowing problematic scanning coordinates to be excluded from the scanning trajectories. This case exemplifies optimal inspection setup planning, where automated ultrasonic scanning coverage is maximized, leaving only a minimal area for manual inspection. The advantages of batch scanning were also highlighted in this example, as downtime was reduced by minimizing operator intervention between scans of different areas of the part.
The importance of defining 3D scanning trajectories based on ultrasonic wave propagation paths was discussed, particularly in cases such as aircraft wing flaps. Since ultrasonic propagation within honeycomb structures is constrained by the cell walls, scanning trajectories must be defined accordingly rather than relying solely on geometrical considerations such as the midplane or the angles of external surfaces.
Various data interpretation and analysis tools were also presented, starting with variable scanning gates. As demonstrated in the examples of carbon composite U-shaped and strake structures, this tool is essential for analyzing composite panels with varying thicknesses. Additionally, the gain correction mapping algorithm was illustrated using an aircraft wing flap as an example. By referencing pre-calibrated attenuation measurements from a known good part, this tool dynamically adjusts the receiver gain for each scanned point, simplifying data interpretation. This was particularly beneficial for the wing flap, where variations in honeycomb thickness resulted in significant differences in ultrasonic wave attenuation. Applying the gain correction map ensured a more uniform response across the scanned surface.
As aerospace components continue to evolve with increasing reliance on composite materials, advanced ultrasonic testing solutions must keep pace with these new challenges while maintaining the rigorous quality control standards that ensure aircraft safety.
Looking for a reprint of this article?
From high-res PDFs to custom plaques, order your copy today!


