How to Calculate Fatigue Life of Disc Springs
For a given load, engineers can calculate the minimum fatigue life for disc springs
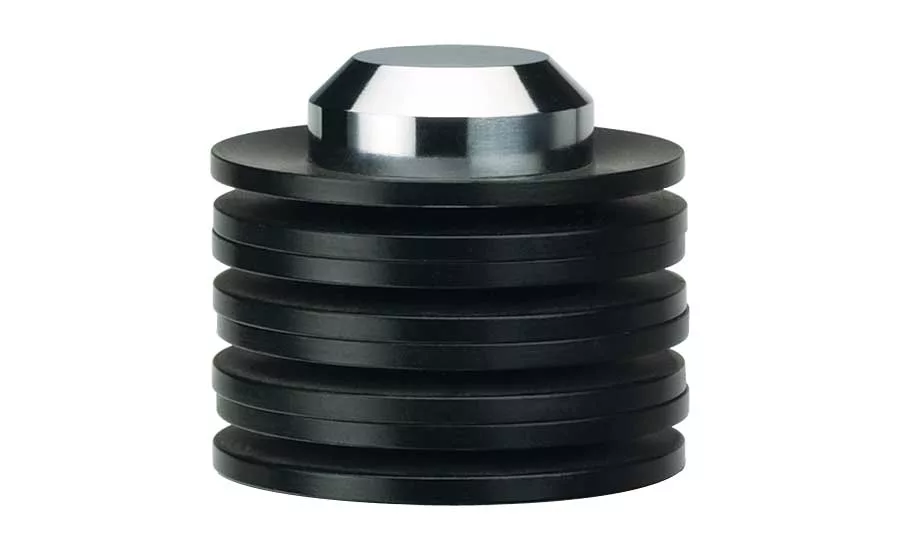
Disc springs are conically shaped, washer-like components designed to be axially loaded.
What makes disc springs unique is that, based on standard calculations (detailed in DIN EN 16984), the deflection for a given load is predictable and the minimum fatigue life can be determined. We offer a full range of Group 1 and 2 disc springs in Series A, B, and C. These springs can be statically loaded continuously or intermittently, or they can be subjected to dynamic loading. They can be used singularly or in multiples. They can be stacked in parallel, in series, or in some combination of the two.
Compared with other types of springs, disc springs have many advantages, including:
- A wide range of load and deflection characteristics.
- High load capacity with small deflection.
- Space savings, due to their high load-to-size ratio.
- Consistent performance under design loads.
- Longer fatigue life.
- Inherent dampening, especially with parallel stacking.
- Flexibility in stack arrangement to meet specific application requirements.
Disc springs are used in many applications, such as aircraft landing gear, pick-off spindles in CNC screw machines, support systems for industrial piping, clutch assemblies on power tools, and brake systems for off-highway equipment.
The latter are typically hydraulically actuated. In most cases, braking occurs when pressurized fluid compresses stationary friction discs against plates that rotate with the driveshaft. The amount of friction between each set of plates controls deceleration. However, without an additional fail-safe system, this design has limited reliability. If a hydraulic seal is compromised, or the hydraulic cylinder loses pressure, the brakes fail.
Disc springs provide a mechanical back-up system. Under normal circumstances, the hydraulic system holds a constant pressure on disc springs stacked in series. If pressure fails to be maintained, the stack of springs decompresses to actuate the braking mechanism. A compression spring or wave spring cannot provide the force required (in the space available) to actuate the brakes. The reliability of this safety system depends on the consistent performance of disc springs.
Disc springs have a consistently high capacity to store potential mechanical energy. Their conical design makes their spring characteristics and performance more predictable than traditional compression springs. Disc springs can also provide more force in less space than a compression spring or wave spring. They are commonly stacked in multiples to achieve application-specific spring rates: a stack in series provides less force over more travel; a stack in parallel provides more force over less travel. The precise tolerances of each spring ensures predictable performance when they are stacked.
Calculating Fatigue
Deflection of a disc spring at a given load is predictable, making it possible to calculate force and stress levels in the disc. As the disc spring flexes, stress levels in the disc change; the greater the change, the faster the disc spring fatigues.
Looking for quick answers on assembly and manufacturing topics? Try Ask ASM, our new smart AI search tool. Ask ASM
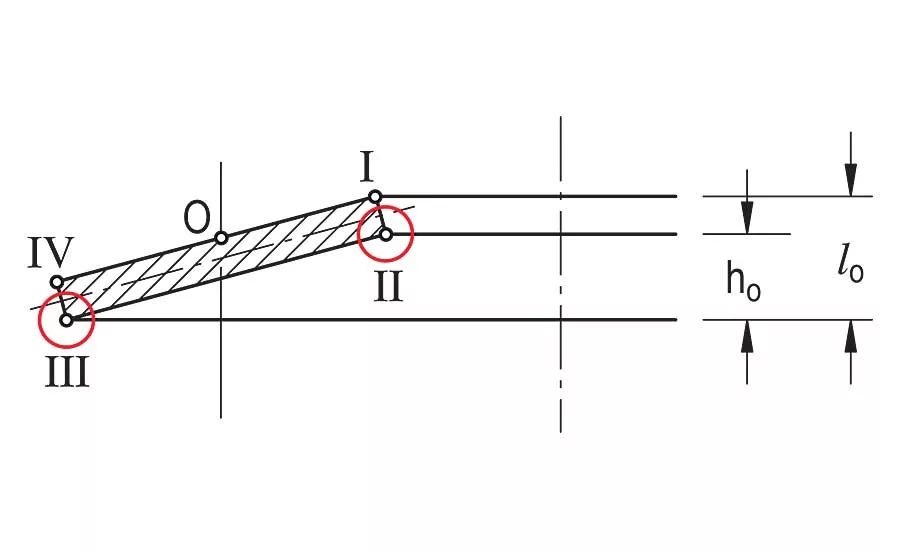
Tensile stress at points II and III in Figure 1 are critical in determining fatigue life. These locations are where fatigue cracks originate. Estimation of fatigue life requires evaluation of the maximum stress difference between the preload and final load at locations II and III. The location with the highest stress differential is used to estimate fatigue life. Once it is determined which stress values will be used (from location II or III), the fatigue life charts in DIN EN 16983 can be used to estimate the fatigue life of the disc spring.
Stress values can be found in our disc spring catalog or the DIN EN 16983 standard. They can also be calculated using formulas from the standard. Fatigue life charts are provided for springs in three thickness ranges: less than 1.25 millimeters; between 1.25 and 6 millimeters, and between 6 and 14 millimeters.
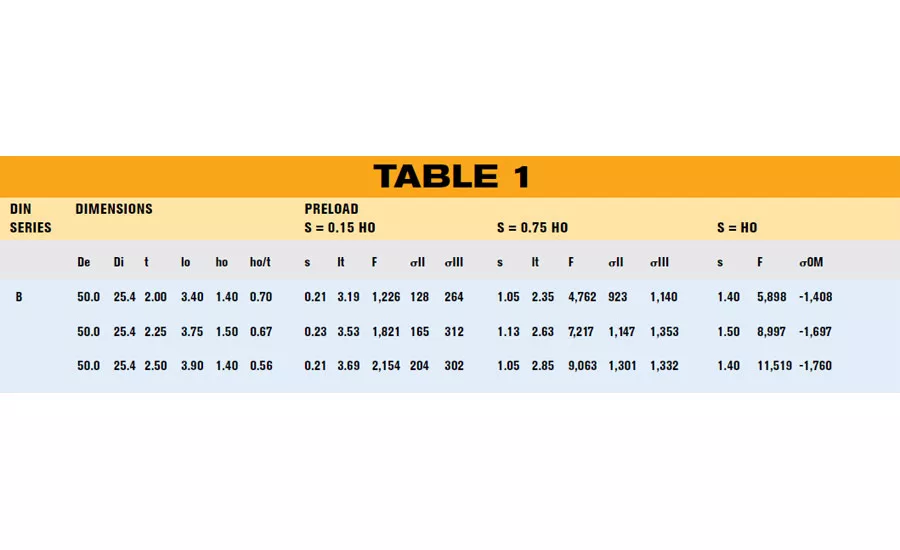
For example, let’s say we needed to estimate the fatigue life of a Series B, Group 2 disc spring with an outside diameter of 50 millimeters, an inside diameter of 25.4 millimeters, and a thickness of 2 millimeters. The preload is 15 percent of the spring’s initial height, and the final position is 75 percent of its initial height.
Using the specification chart shown in Table 1, at 15 percent of the spring’s initial height, the stress at location II (σII) is 128 newtons per square millimeter (N/mm2) and the stress at location III (σIII) is 264 N/mm2. Similarly, at 75 percent of the spring’s initial height, the stress at σII is 923 N/mm2 and the stress at σIII is 1,140 N/mm2. Now, we can calculate the differences between the stresses at each location.
Location II: 923 – 128 = 795 N/mm2.
Location III: 1,140 – 264 = 876 N/mm2.
The calculations indicated the maximum differential in stress occurs at location III. Therefore, we will use the stress values from
location III, and the fatigue life charts to estimate the fatigue life of the disc spring.
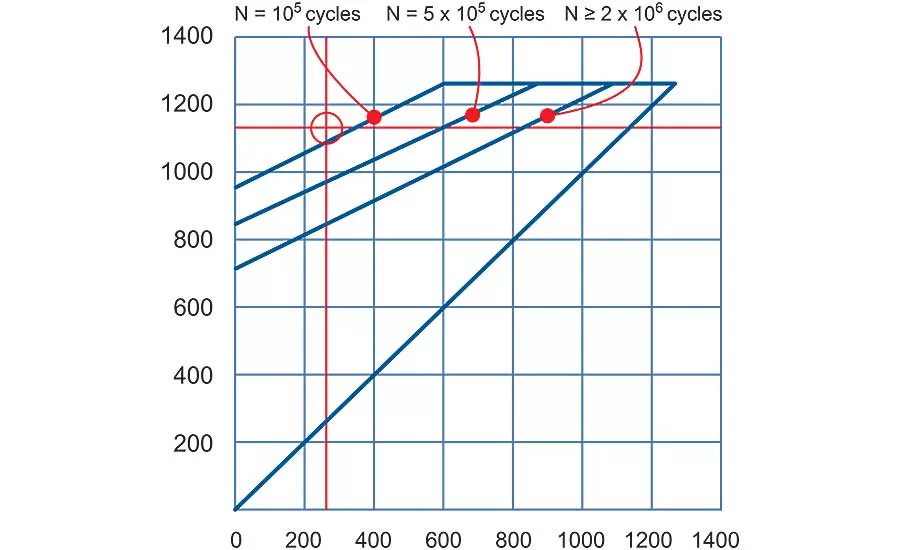
To use the chart, draw a vertical line drawn on the X axis representing the minimum stress at location III and draw a horizontal line on the Y axis representing the maximum stress at location III. (See Chart 1.) The intersection of these two lines is the estimated fatigue life. Thus, in our example, the line on the X axis is drawn at 264 N/mm2, and the line on the Y-axis is drawn at 1,140 N/mm2. The intersection is slightly above the 100,000 cycle line, so the estimated fatigue life of the spring would be slightly less than 100,000 cycles.
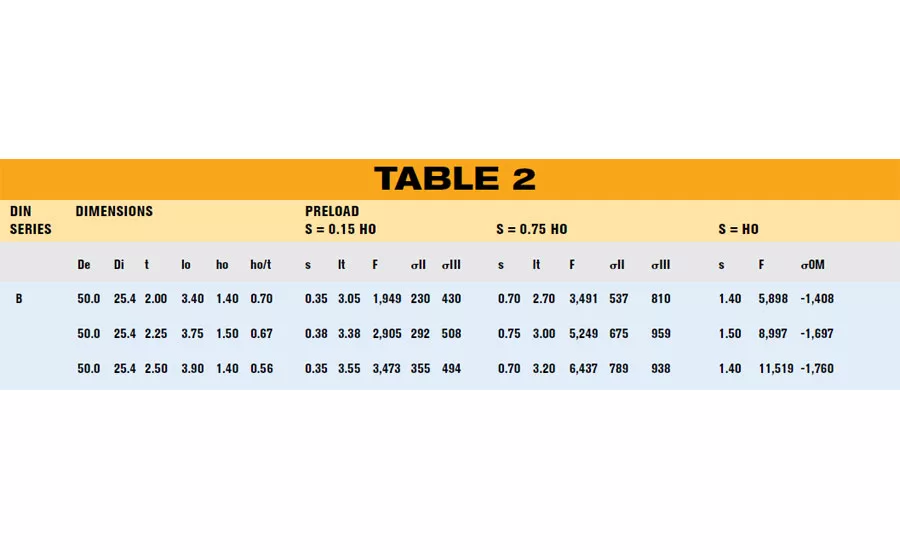
Let’s look at another example. We’ll use the same disc spring, only this time, the preload is 25 percent of the spring’s initial height, and the final position is 50 percent of its initial height.
Using the specification chart shown in Table 2, at 25 percent of the spring’s initial height, the stress at σII is 230 N/mm2 and the stress at σIII is 430 N/mm2. And, at 50 percent of the spring’s initial height, the stress at σII is 537 N/mm2 and the stress at σIII is 810 N/mm2. Next, we calculate the differences between the stresses at each location.
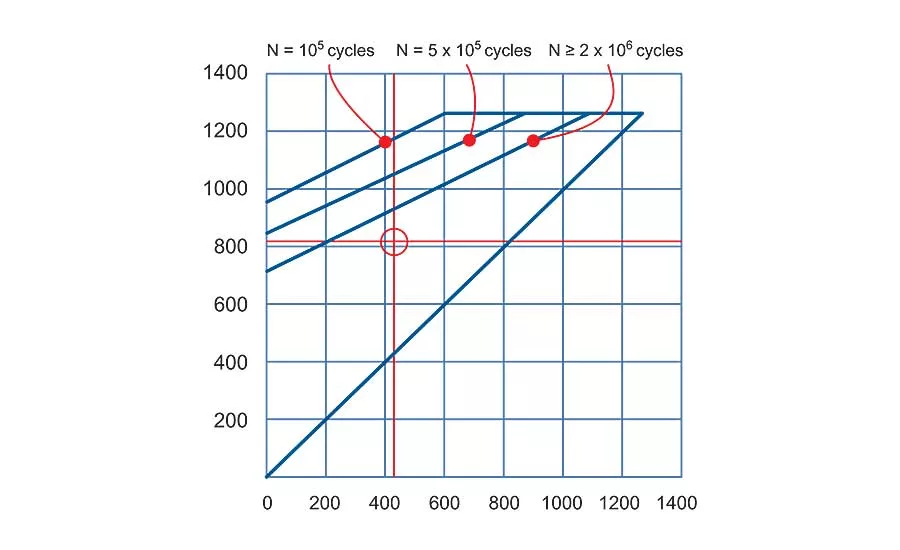
Again, the maximum stress differential occurs at location III. Referencing Chart 2, we plot 430 N/mm2 on the X axis and 810 N/mm2 on the Y axis. The intersection of the lines is slightly below the 2 million cycle line. Therefore, the estimated fatigue life is more than 2 million cycles.
These examples highlight how a reduction in deflection results in an increase in fatigue life.
The fatigue life charts are based on laboratory testing performed on single discs at room temperature. Testing is done at a frequency that does not result in heat buildup. Test discs are lubricated and tested on polished anvils; actual fatigue life is likely to be different than values estimated in the fatigue life charts. These charts are valid for single discs and stacks of a maximum of 10 disc springs in series. Discs springs stacked in parallel will have reduced fatigue life due to heat buildup resulting from friction.
In summary, the deflection range of a disc spring determines its fatigue life. Increasing final load increases stress in the disc spring resulting in lower fatigue life. Increasing preload reduces deflection resulting in increased fatigue life. Testing is necessary under actual conditions to verify fatigue estimates.
Looking for a reprint of this article?
From high-res PDFs to custom plaques, order your copy today!


