Fastening: The Truth About TORQUE and TENSION
A common misconception exists about the relationship between torque, tension and friction as a threaded fastener is tightened. This misconception has persisted unquestioned for many years, appearing and reappearing in technical writing for years. And, it may be influencing deeply held beliefs about fastener behavior during the tightening process.
The traditional equations used to describe tightening behavior are correct, but the misconception results from misinterpreting their meaning. The most practical and commonly accepted equation for describing the tightening process is shown below. It can be found in many articles on fastening.
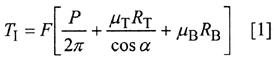
TI is total input torque applied to the fastener. F is the tensile force generated in the bolt as a result of tightening. P is the thread pitch. µT is the coefficient of friction between the internal and external threads. RT is the radius at which frictional force in the threads is assumed to act. a is the thread flank angle; a is 30 degrees for the common 60-degree thread form. µB is the coefficient of friction between the fastener and the bearing surface under the fastener. RB is the radius at which frictional force between the fastener and bearing surface is assumed to act.
This equation captures the major variables and effects of the tightening process. Although other equations encompass additional variables, these variables have relatively minor effects in most tightening situations.
It's also common practice to mathematically separate Equation 1 and show the three components of total input torque as:
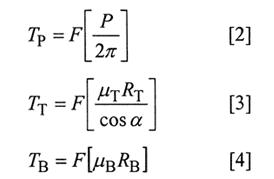
TP is the pitch torque, the component of input torque that creates tensile force in the bolt through the wedging action of the threads. TT is the thread torque, the component of input torque that must overcome friction between the internal and external threads as they slide across each other. TB is the bearing surface torque, the component of input torque that must overcome friction between the fastener and bearing surface.
We can easily see that thread torque and bearing surface torque are directly proportional to their respective coefficients of friction. We then conclude with an equation for input torque in terms of its three components:
TI = TP + TT + TB [5]
Looking for quick answers on assembly and manufacturing topics? Try Ask ASM, our new smart AI search tool. Ask ASM
How the Error Develops
Equations 1 through 5 correctly represent the behavior of a threaded fastener as it is tightened. However, it is possible to make a fundamental error when interpreting their meaning. The error may develop in the following manner.We begin with Equation 5 for input torque as the sum of its three component torques. Our first instinct is to think that each component contributes equally to total input torque. In fact, the pitch, thread and bearing surface torques represent 10 percent, 40 percent and 50 percent, respectively, of total input torque. Moreover, only pitch torque produces bolt tension.
While these models are correct, they may be misinterpreted. For example, we might think that by reducing bearing surface friction, we can reduce the maximum bearing surface torque by, say, 10 newton-meters. At a constant maximum input torque, that 10 newton-meters of torque will be added to the pitch torque causing a corresponding increase in bolt tension. Or, we might think that reducing thread torque by x newton-meters will result in a corresponding increase in the pitch torque of x newton-meters and the bolt tension will increase accordingly. Both of these ideas are incorrect.
We can follow this logic for a simple tightening scenario. Imagine a situation in which 50 newton-meters of input torque creates a bolt tension of 40 kilonewtons. If the pitch, thread and bearing surface torques represent 10 percent, 40 percent and 50 percent of total input torque, then the pitch torque is 5 newton-meters, the thread torque is 20 newton-meters, and the bearing torque is 25 newton-meters.
Recalling Equation 5, one may conclude that if bearing surface torque can be reduced by 20 percent (5 newton-meters) then that "saved" 5 newton-meters of bearing surface torque must be added to the original pitch torque (5 newton-meters + 5 newton-meters). The pitch torque thus becomes 10 newton-meters. Because pitch torque directly affects bolt tension, the bolt tension is doubled for the same input torque. It appears that a 20 percent reduction in bearing surface torque (resulting from a 20 percent reduction in bearing surface friction) causes a 100 percent increase in bolt tension.
This conclusion seems quite logical, but it is wrong!
The culprit is an incomplete mental model of tightening based on Equation 5 for input torque. To illustrate the correct answer, let's apply Equation 1 to another scenario, involving two values for the bearing surface coefficient of friction. One value is 20 percent greater than the other--the same friction situation as in the first example. We'll use the following values:
TI (required input torque) = x newton-meters
F (required bolt tension) = 10 kilonewtons
P = 1 millimeter
µT = 0.2
µB = 0.187
RT = 2.74 millimeters
RB = 5.25 millimeters
α= 30 degrees.
Plugging these numbers into Equation 1, we find that to produce a bolt tension of 10 kilonewtons, input torque (TI) would have to be 17.7 newton-meters.
We now reduce bearing surface friction by 20 percent, from 0.187 to 0.15, to determine if a dramatic increase in bolt tension will indeed occur as indicated by an intuitive application of Equation 5. Recalculating Equation 1 with the lower bearing surface friction and solving for bolt tension with the constant maximum input torque of 17.7 newton-meters, we find that the bolt tension is 11.2 kilonewtons.
Thus we see that, at a constant input torque of 17.7 newton-meters, a 20 percent decrease in bearing surface friction caused an 11 percent increase in bolt tension (from 10 kilonewtons to 11.2 kilonewtons), not the 100 percent change that our mental model suggests. Similarly, a 25 percent increase in bearing surface friction (from 0.15 to 0.187) does not cause a 50 percent decrease in bolt tension.
We can see that, while the basic equations are correct, something is wrong with our mental model of tightening when we base it on Equation 5 for input torque. Somehow, we must be misinterpreting the equation.
A System Model for Tightening
Clearly, we need a new model of tightening behavior. We know that Equation 5 is correct. The question is, "Correct for what?" Because Equation 5 breaks down once friction and bolt tension are involved, I suggest that it is only correct for the tool portion of a tightening system comprised of both the tool and the joint.The tool portion of the system consists the mechanism for applying input torque (a hand wrench or a power tool) and its contact interface with the fastener. Equation 5 shows that there is a cause and effect relationship between input torque and its three components. And, if we consider Equation 5 only with respect to tool behavior, we can conclude that it is correct. At any point in the tightening process, we can solve the equation for any of its torque variables and get a correct answer. The tool portion of the system does not involve bolt tension because only the tool itself experiences torque.
The joint is the other member of the tightening system. The joint consists of a bolt, an internal thread, a bearing surface and the clamped members. The pitch torque creates bolt tension. Simultaneously, bolt tension creates resistance to further tightening in the form of thread torque and bearing surface torque. Collectively, the thread and bearing surface torques are a torque loss.
The joint model indicates that the relationship between pitch torque and torque loss is a function of bolt tension. So, any attempt to calculate interactions of these variables must include bolt tension. Input torque is not important in the joint portion of the system model. It does not appear in the joint model, just as friction and bolt tension do not appear in the tool model.
The tool and joint models can be combined to represent an entire tightening system. This combined model shows the complex relationship between bolt tension and input torque.
New Equations for Tightening
A system model is important because it supports a correct intuitive understanding of fastener behavior during tightening. For analysis, however, equations are needed.Equation 1 is adequate for evaluating fastener behavior during tightening. However, it is desirable to have explicit equations for expressing change in the system.
For determining the adjustment in input torque required to maintain a constant bolt tension as friction changes, Equation 6, shown in Fig. 7, is recommended. In Equation 6, the change in input torque is ΔT. Changes in friction (Δµ) are expressed as positive or negative values as appropriate. By including numerical values for p and the cosine of a for a 60-degree thread form, Equation 6 can be simplified to Equation 7, also shown in Fig. 7.
Equations 6 and 7 are useful for evaluating the effects of friction changes when input torque must be adjusted to maintain a certain level of bolt tension. Note that bolt tension does not appear in these equations, indicating that changes in input torque with respect to changes in friction are independent of bolt tension. This is consistent with the tool portion of the system model.
For evaluating changes in bolt tension at a constant input torque, Equation 8, shown in Fig. 8, is recommended. The change in bolt tension is ΔF.
Equation 8 can be simplified into Equation 9 by including numerical values for p and the cosine of a for a 60-degree thread form. Equation 9 is also shown in Fig. 8.
Equations 8 and 9 are useful for evaluating the effects of friction changes on bolt tension when input torque is expected to remain constant. (The derivation of Equations 6 through 9 can be found at www.assemblymag.com.)
Input torque does not appear as a variable in Equations 8 and 9, indicating that changes in bolt tension with respect to changes in friction are independent of input torque. This is consistent with the joint portion of the system model.
Revisiting the tightening scenario used in our earlier example, we can apply Equation 8 to reach the same result. The change in friction to be evaluated is ΔµB = (0.15 - 0.187) = 0.037.
We find that:
ΔF = 1.2 kilonewtons
and
F2 = ΔF + F
so:
F2 = 1.2 kilonewtons + 10 kilonewtons = 11.2 kilonewtons.
This result agrees with the value for bolt tension that was calculated earlier using Equation 1.
Equations 1, 6 and 8 are recommended for evaluating the behavior of bolted joints during tightening. Equation 1 provides a means for evaluating "real-time" behavior of any joint system as tightening occurs. Equations 6 and 8 allow comparison between design alternatives in which friction values change. Equation 5 is not appropriate for inferring or calculating the effects of friction on joint behavior.
Any discussion of tightening behavior must include an explanation of the independent nature of the tool and joint systems, as well as the hazards of misapplying tool system thinking to an entire joint system.
For more information, call Paul Bonenberger at 248-214-8950, e-mail paulrb@fasteningsmart.net, or visit http://fasteningsmart.net/home.html.
Looking for a reprint of this article?
From high-res PDFs to custom plaques, order your copy today!