Quality in Assembly: How Capable Are Your Power Tools?
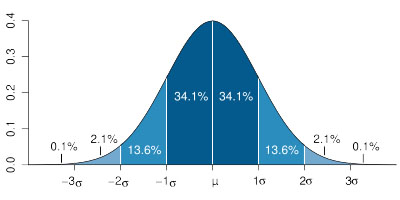
In a histogram of torque data, the area under the curve that lies within one standard deviation of the mean represents 68 percent of all torque readings in the data set. The area within two deviations represents 95 percent of all readings, and the area within three deviations represents 99.7 percent of all readings.
No matter how accurate the tool, there will always be some variation in how much torque is applied to a fastener. Too many factors influence the process. Variation in air pressure, friction, part dimensions, operator skill and other factors means that one fastener will be slightly tighter or looser than the next. Statistical analysis can tell engineers when such variation is unacceptable.
One way to look at fastening data is with a histogram, a bar graph that indicates how often certain values occur. In a histogram of torque data, for example, the X axis shows the range of torque values, while the Y axis shows how frequently each value came up. This histogram will follow a normal distribution. That is, the values are distributed along a bell-shaped curve that is symmetrical about the mean torque value.
Every reading in the set will differ slightly from the mean. The standard deviation is the amount by which each reading is most likely to differ from the average. Usually denoted by the Greek letter, s, the standard deviation indicates how well a process is performing. If torque accuracy is critical, engineers will want a curve that is tall and narrow.
To find the standard deviation, subtract the mean from the torque value of each fastening operation. Square each result, add them all together, and then divide this sum by the number of fastening opera-tions. This is the variance. Take the square root of the variance to get the standard deviation.
In the histogram, the area under the curve that lies within one standard deviation of the mean represents 68 percent of all torque readings in the data set. The area within two deviations represents 95 percent of all readings, and the area within three deviations represents 99.7 percent of all readings.
Why is this important? If 99.7 percent of torque values fall within three standard deviations of the mean due to normal variation, such as friction, then engineers know a problem-something outside the norm-is occurring if the tool starts reporting torque values outside that range. Perhaps the tool is bro-ken, or the operator is installing the wrong screw.
The same analysis can determine if a new tool is accurate enough to meet your specification. Let’s say a bolt should be tightened to 20 newton-meters ±10 percent. For the tool to meet that specification, it would have to tighten the bolt such that three standard deviations would be within ±10 percent of 20 newton-meters. After multiple run-downs on a sample joint, the tool produces an average torque of 20 newton-meters and a standard deviation of 0.5 newton-meter. Now do the math: [(3 x 0.5) ÷ 20] x 100 = 7.5%. The tool will work.
This analysis can be done even if the tool will be used on both hard and soft joints. In this case, the mean for the hard joint will be higher than that for the soft. Plotted separately, the histograms will overlap. To determine if the tool is accurate enough, you must calculate whether the combined torque scatter falls within your tolerance range. At one end will be the mean for either the hard joint or the soft joint plus three standard deviations, whichever is higher. At the other end will be the mean for either the hard joint or the soft joint minus three standard deviations, whichever is lower. To determine the accuracy, subtract the high end from the low end, multiply by 50, and divide the result by the average torque value for both joints combined.
Next month: More fun with fastening statistics!
Looking for a reprint of this article?
From high-res PDFs to custom plaques, order your copy today!


